- Home >
- Stock Photos >
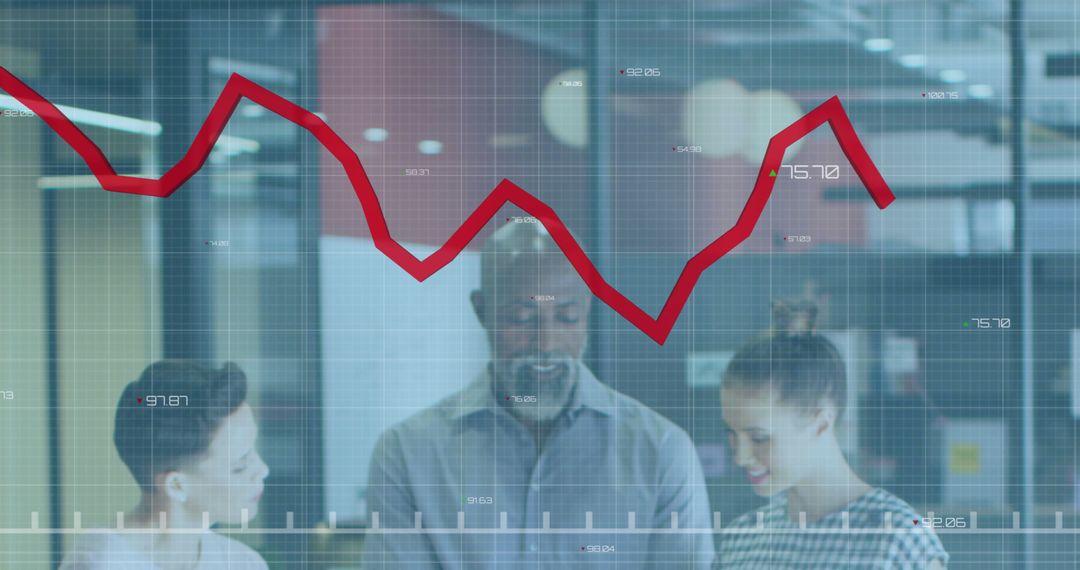
- Business Team Analyzing Financial Data with Interactive Charts and Graphs in Modern Office
Business Team Analyzing Financial Data with Interactive Charts and Graphs in Modern Office Image

Business team standing around table reviewing financial charts projected across frame, combining human collaboration with digital analytics overlay. Line and bar graphs foregrounding scene while laptop and documents sit on table, suggesting active discussion and strategic planning. Color overlay and numeric labels creating dynamic visuals emphasizing growth, trends, and performance metrics. Left side containing negative space for headline text, logo, or call to action, making composition ideal for hero banners and website headers. Suitable uses include corporate presentations, investor pitch decks, annual reports, fintech marketing, business blog posts, social media campaigns, and internal training materials. Crop for widescreen layouts or use full frame for desktop backgrounds and report covers. High-resolution composition supporting bold typography and data-driven messaging.
Powered by  - Get 15% off with code: PIKWIZARD15


0
downloads
downloads
Tags:
More
Credit Photo
If you would like to credit the Photo, here are some ways you can do so
Text Link
photo Link
<span class="text-link">
<span>
<a target="_blank" href=https://pikwizard.com/photo/business-team-analyzing-financial-data-with-interactive-charts-and-graphs-in-modern-office/93f02dec760570c9d6fa48b2b22a5227/>PikWizard</a>
</span>
</span>
<span class="image-link">
<span
style="margin: 0 0 20px 0; display: inline-block; vertical-align: middle; width: 100%;"
>
<a
target="_blank"
href="https://pikwizard.com/photo/business-team-analyzing-financial-data-with-interactive-charts-and-graphs-in-modern-office/93f02dec760570c9d6fa48b2b22a5227/"
style="text-decoration: none; font-size: 10px; margin: 0;"
>
<img src="https://pikwizard.com/pw/medium/93f02dec760570c9d6fa48b2b22a5227.jpg" style="margin: 0; width: 100%;" alt="" />
<p style="font-size: 12px; margin: 0;">PikWizard</p>
</a>
</span>
</span>
Free (free of charge)
Free for personal and commercial use.
Author: Creative Art
Similar Free Stock Images

Premium


Premium


Premium


Premium


Premium


Premium


Premium


Premium


Premium


Premium


Premium


Premium


Premium


Premium


Premium


Premium


Premium


Premium


Premium


Premium


Premium


Premium


Premium


Premium