
- Home >
- Stock Photos >
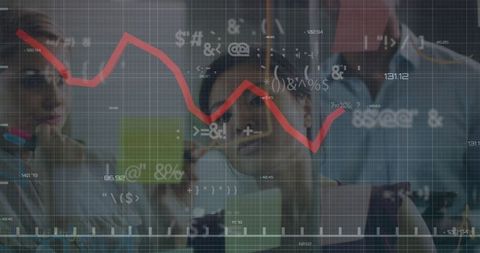
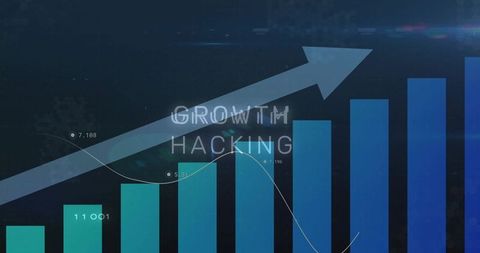
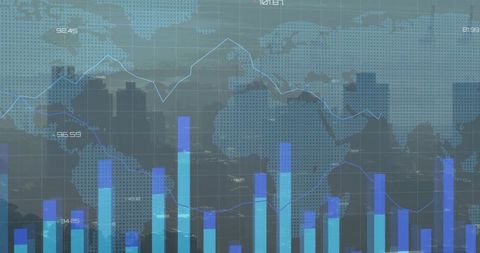
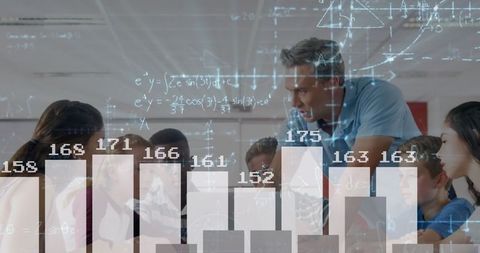
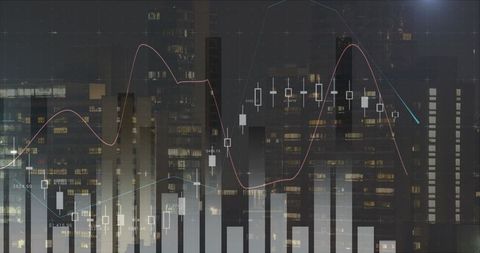
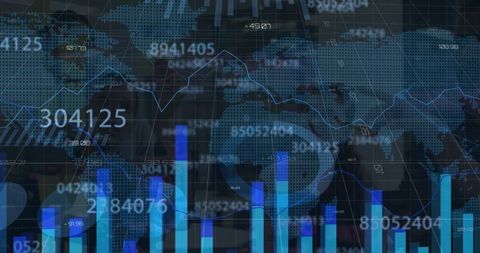
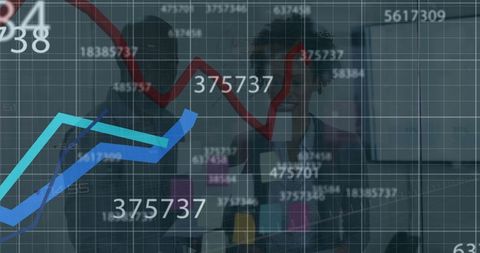
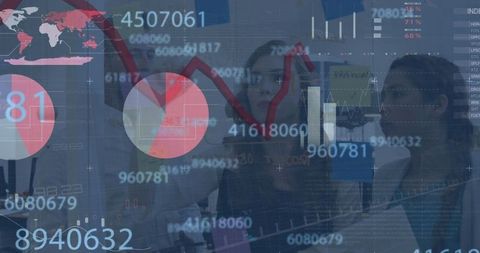
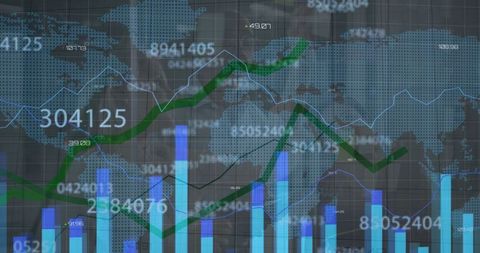
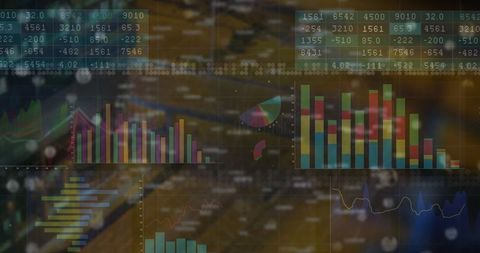
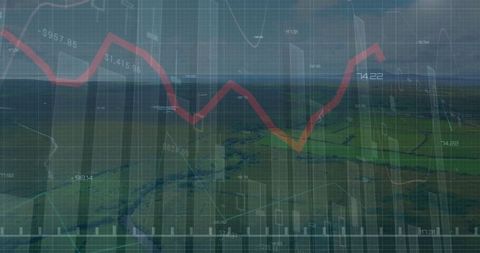
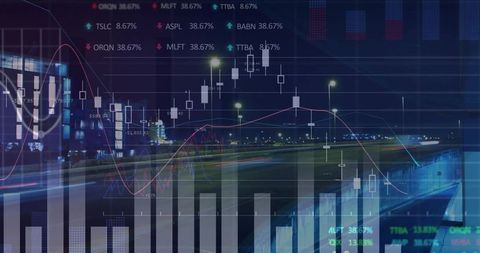
- Business Team Analyzing Global Financial Data Trends in Modern Office
Business Team Analyzing Global Financial Data Trends in Modern Office Image
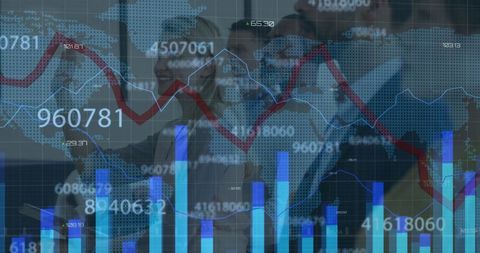
Five business professionals in a modern office are reviewing data trends displayed over geographical maps with graphs, indicating a global perspective on financial analytics. Useful for illustrating collaboration in corporate settings, financial forecasting, or presentations related to business growth strategies. Suitable for content on data visualization, finance strategies, and teamwork dynamics in organizations.
Powered by  - Get 15% off with code: PIKWIZARD15


4
downloads
downloads
Tags:
More
Credit Photo
If you would like to credit the Photo, here are some ways you can do so
Text Link
photo Link
<span class="text-link">
<span>
<a target="_blank" href=https://pikwizard.com/photo/business-team-analyzing-global-financial-data-trends-in-modern-office/af355ceb2e2255d79c60e35d876b3213/>PikWizard</a>
</span>
</span>
<span class="image-link">
<span
style="margin: 0 0 20px 0; display: inline-block; vertical-align: middle; width: 100%;"
>
<a
target="_blank"
href="https://pikwizard.com/photo/business-team-analyzing-global-financial-data-trends-in-modern-office/af355ceb2e2255d79c60e35d876b3213/"
style="text-decoration: none; font-size: 10px; margin: 0;"
>
<img src="https://pikwizard.com/pw/medium/af355ceb2e2255d79c60e35d876b3213.jpg" style="margin: 0; width: 100%;" alt="" />
<p style="font-size: 12px; margin: 0;">PikWizard</p>
</a>
</span>
</span>
Free (free of charge)
Free for personal and commercial use.
Author: Creative Art
Similar Free Stock Images

Premium


Premium


Premium


Premium


Premium


Premium


Premium


Premium


Premium


Premium


Premium


Premium


Premium


Premium


Premium


Premium


Premium


Premium


Premium


Premium


Premium


Premium


Premium


Premium


Premium

