- Home >
- Stock Photos >
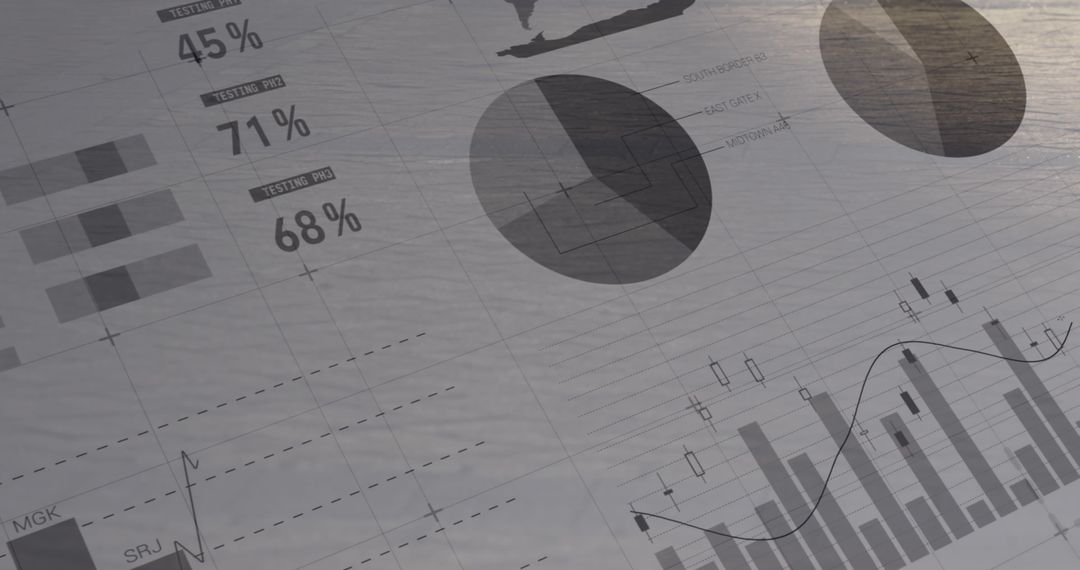
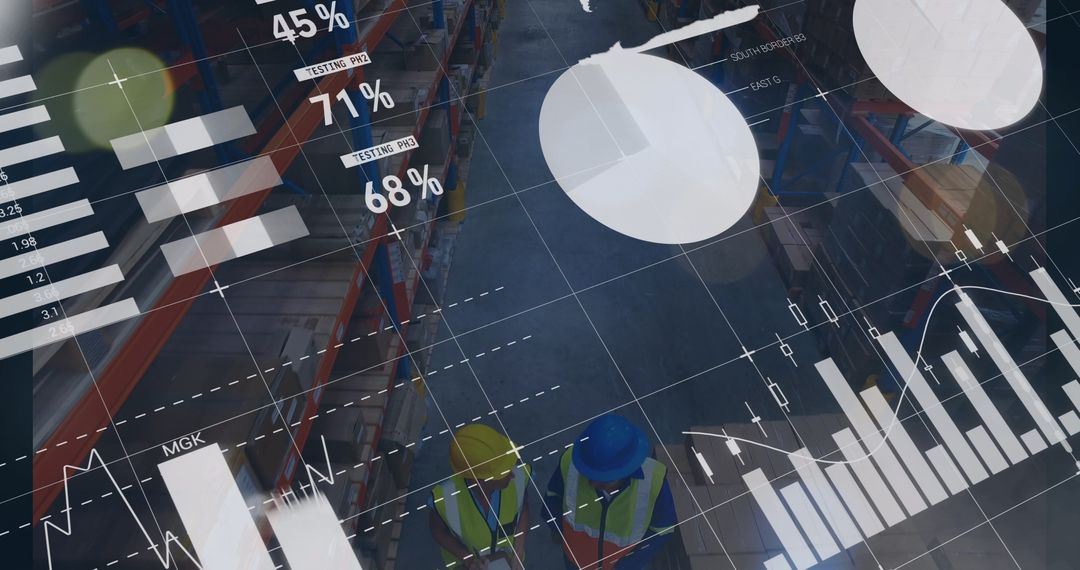
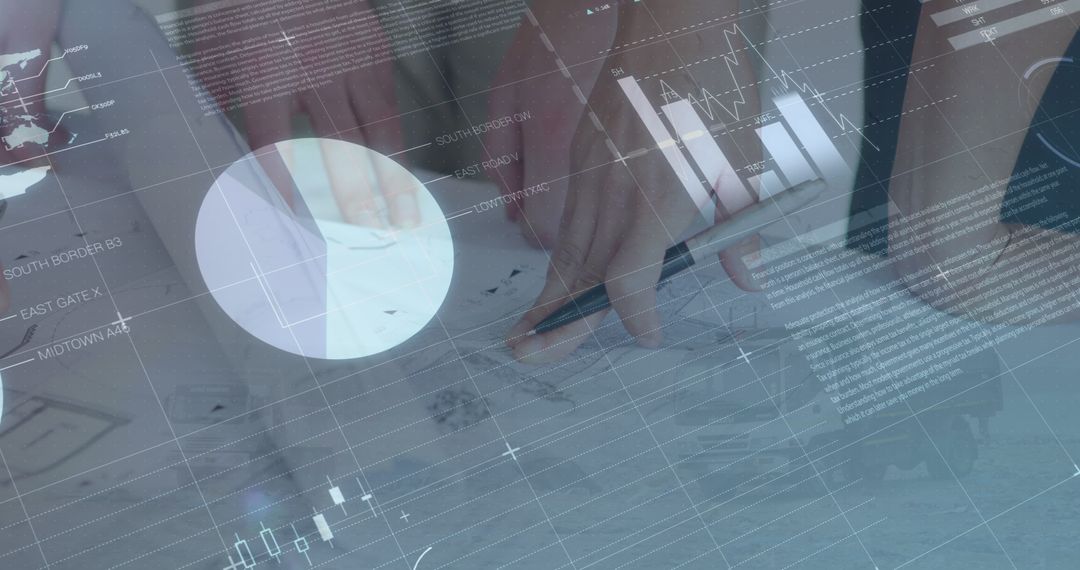
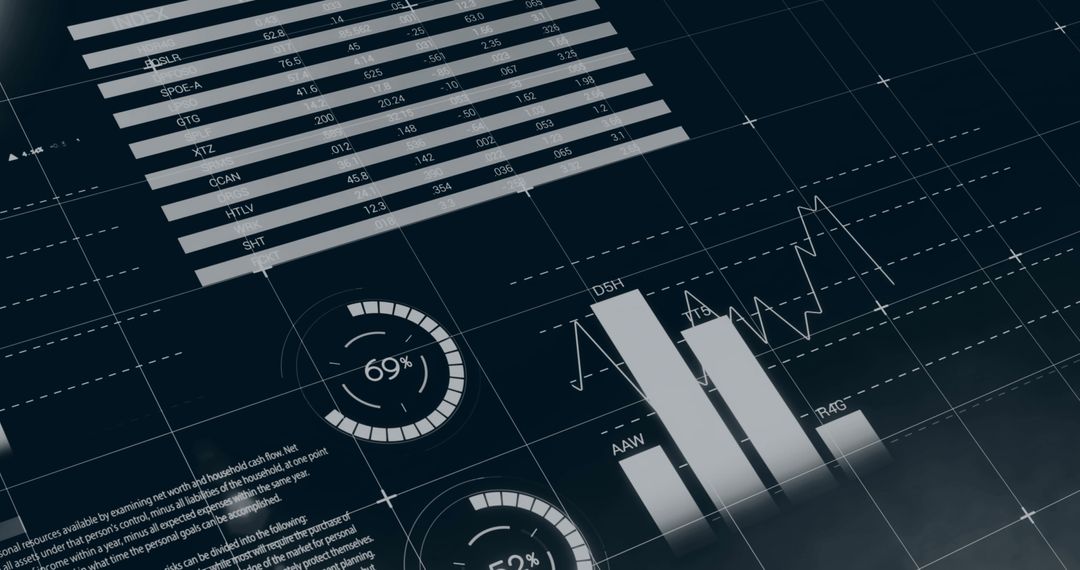
- Business Tools Overlays with Graphs and Charts Decor
Business Tools Overlays with Graphs and Charts Decor Image

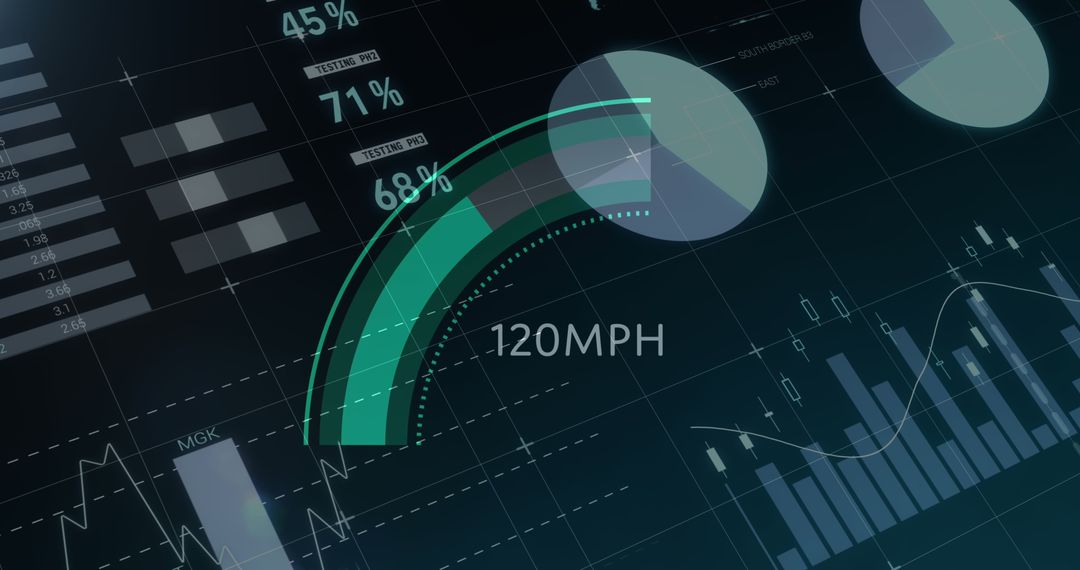
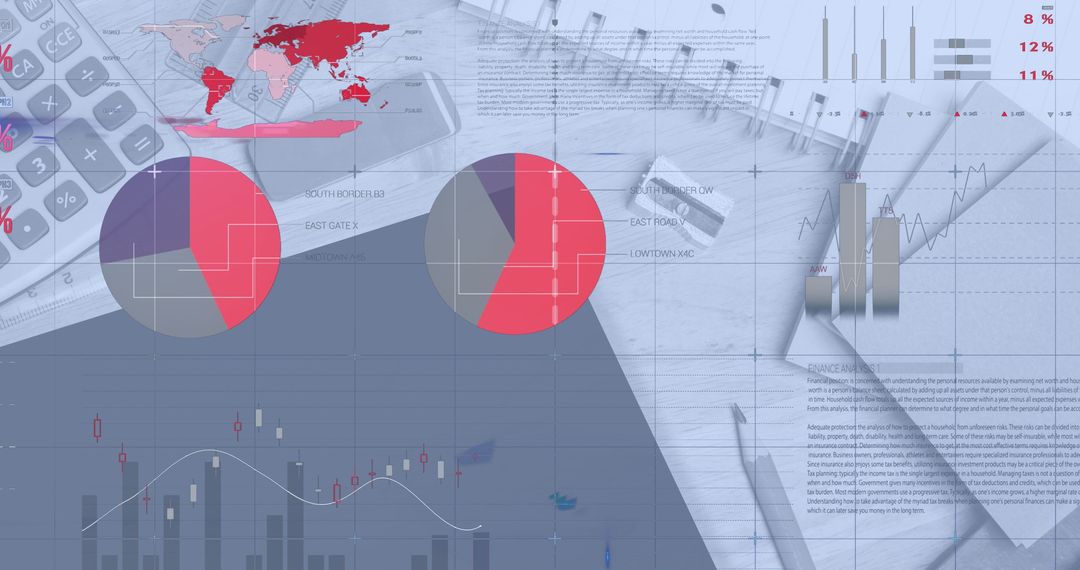
This image combines traditional office equipment like a notepad, pen, and calculator with advanced digital elements. Overlaid graphs and charts suggest data analysis and technological integration. Useful for illustrating concepts of business innovation, data analytics, and the transition from traditional to digital workings. Suitable for websites, presentations, or articles discussing business technology trends.
Powered by  - Get 15% off with code: PIKWIZARD15


2
downloads
downloads
Tags:
More
Credit Photo
If you would like to credit the Photo, here are some ways you can do so
Text Link
photo Link
<span class="text-link">
<span>
<a target="_blank" href=https://pikwizard.com/photo/business-tools-overlays-with-graphs-and-charts-decor/1efb80cfe62df55df069ba5d0ae0e823/>PikWizard</a>
</span>
</span>
<span class="image-link">
<span
style="margin: 0 0 20px 0; display: inline-block; vertical-align: middle; width: 100%;"
>
<a
target="_blank"
href="https://pikwizard.com/photo/business-tools-overlays-with-graphs-and-charts-decor/1efb80cfe62df55df069ba5d0ae0e823/"
style="text-decoration: none; font-size: 10px; margin: 0;"
>
<img src="https://pikwizard.com/pw/medium/1efb80cfe62df55df069ba5d0ae0e823.jpg" style="margin: 0; width: 100%;" alt="" />
<p style="font-size: 12px; margin: 0;">PikWizard</p>
</a>
</span>
</span>
Free (free of charge)
Free for personal and commercial use.
Author: People Creations
Similar Free Stock Images

Premium


Premium


Premium


Premium


Premium


Premium


Premium


Premium


Premium


Premium


Premium


Premium


Premium


Premium


Premium


Premium


Premium


Premium


Premium


Premium


Premium


Premium


Premium


Premium