- Home >
- Stock Photos >
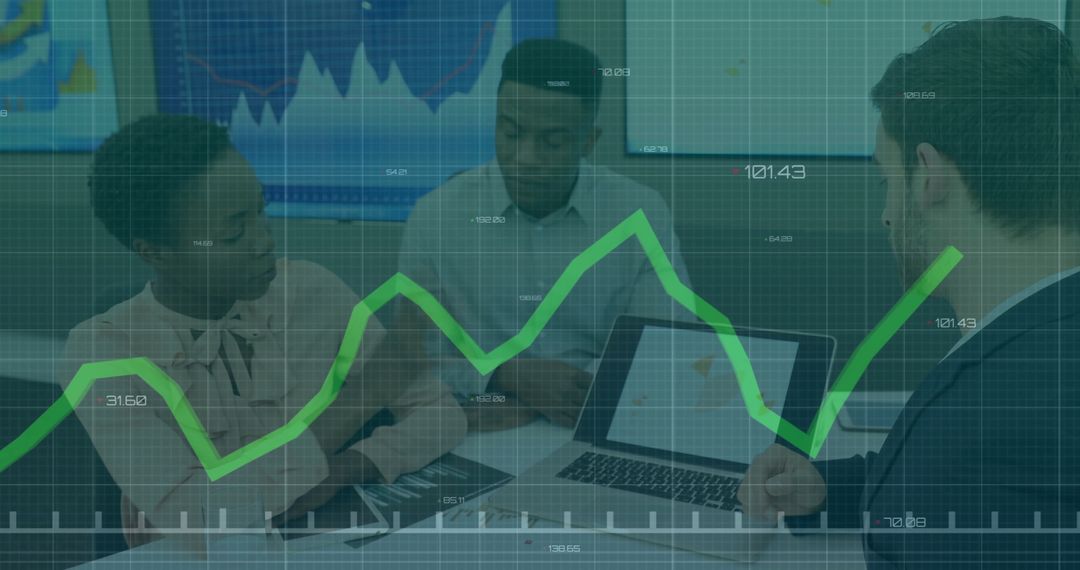
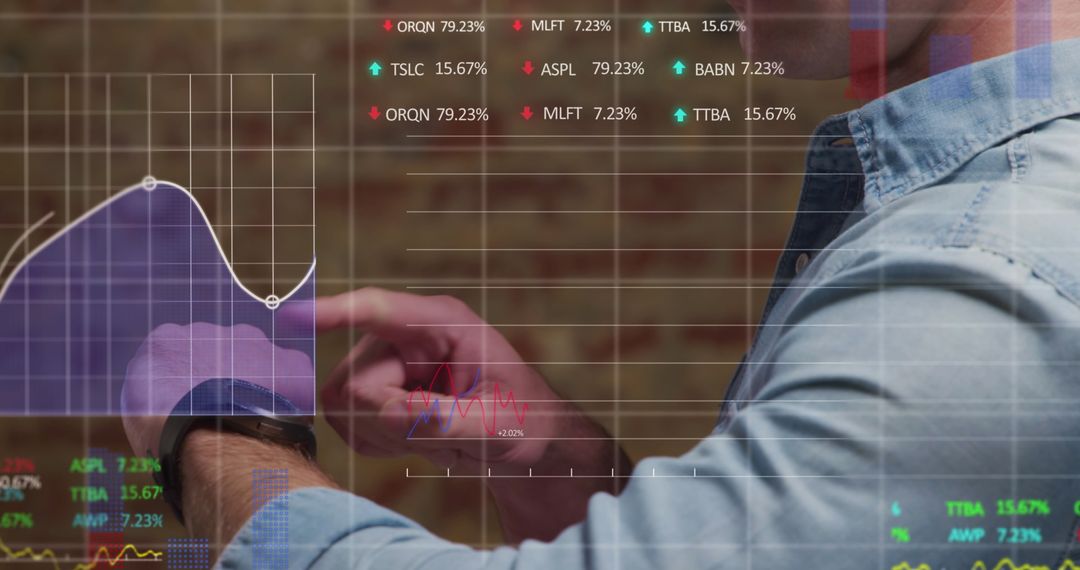
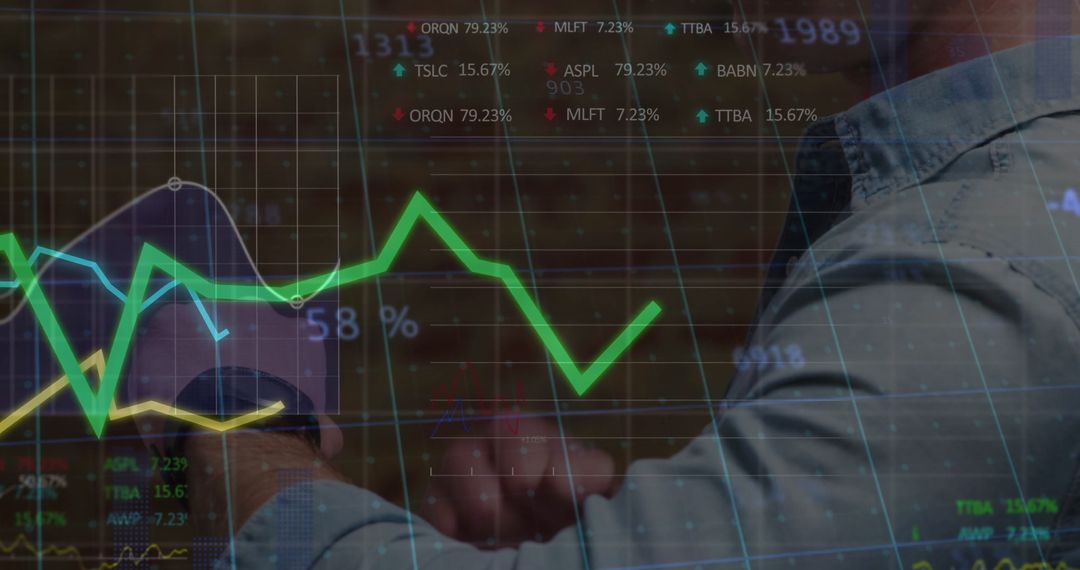
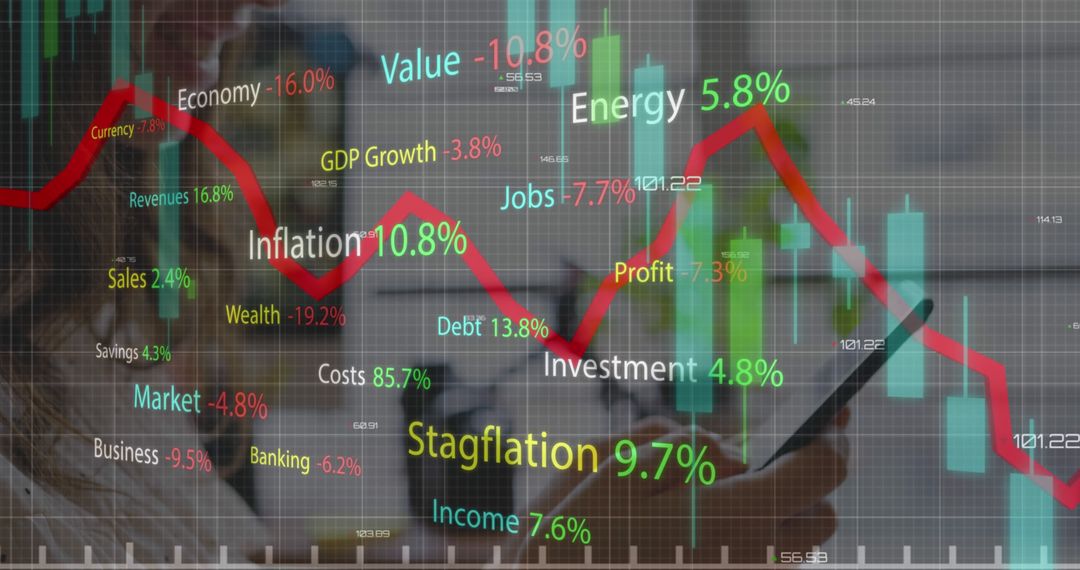
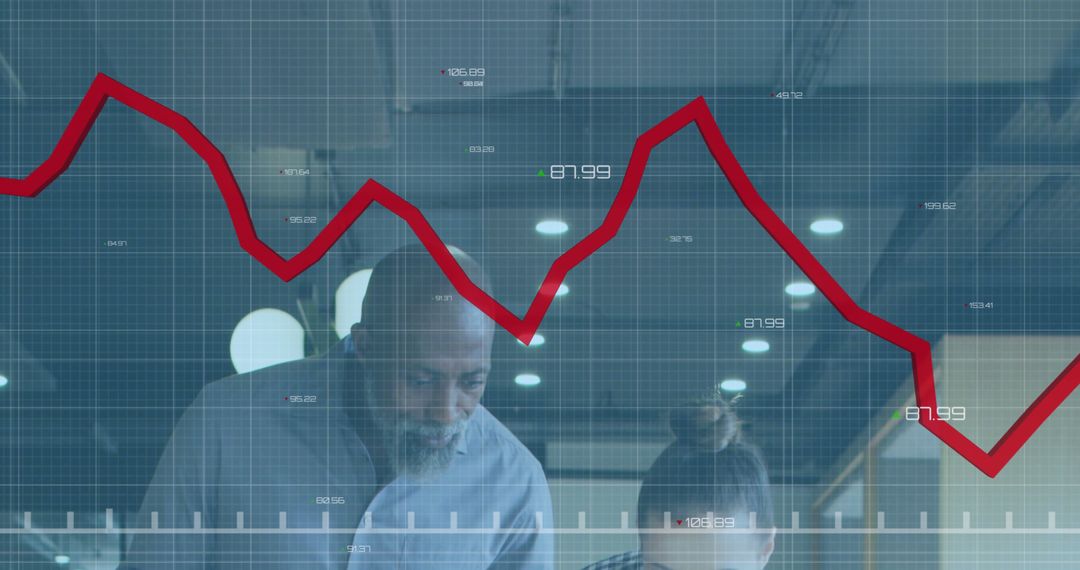
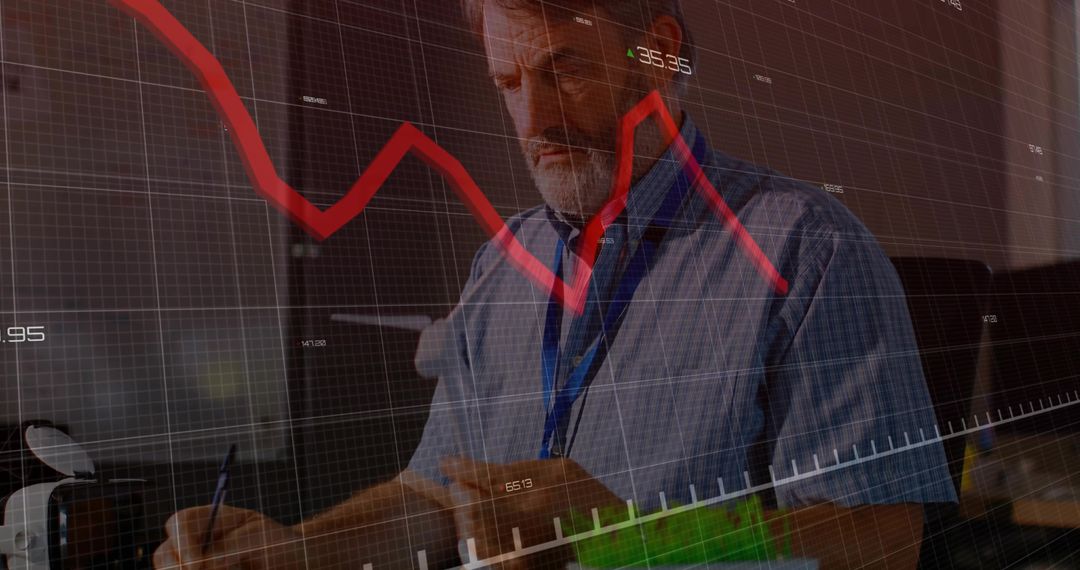
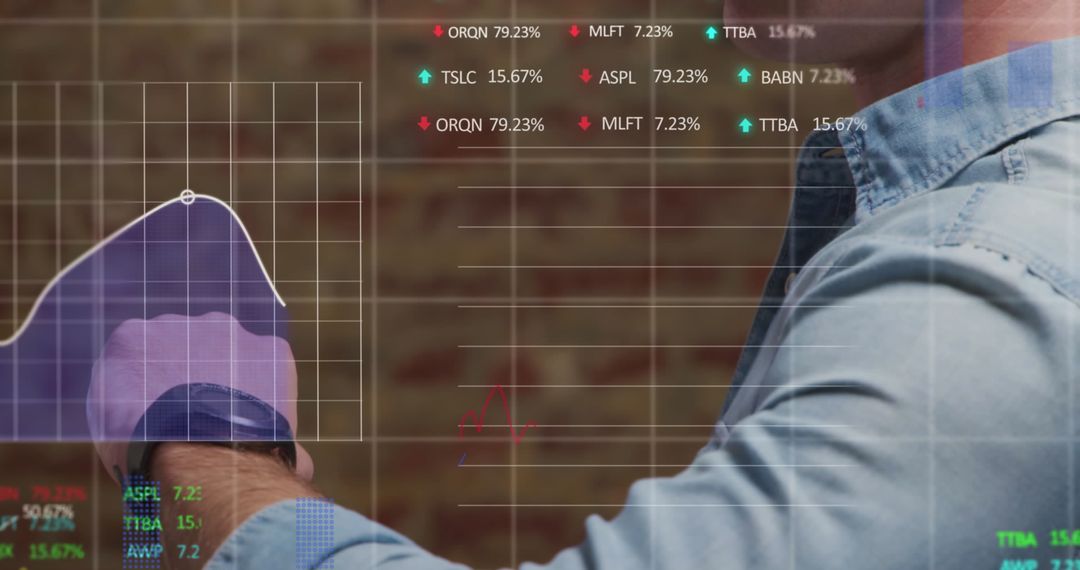
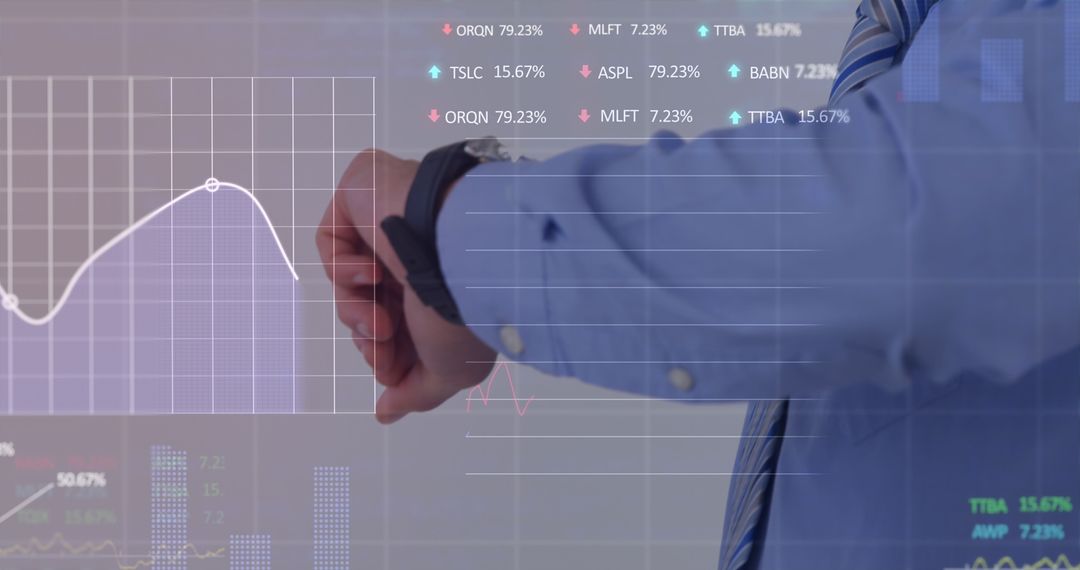
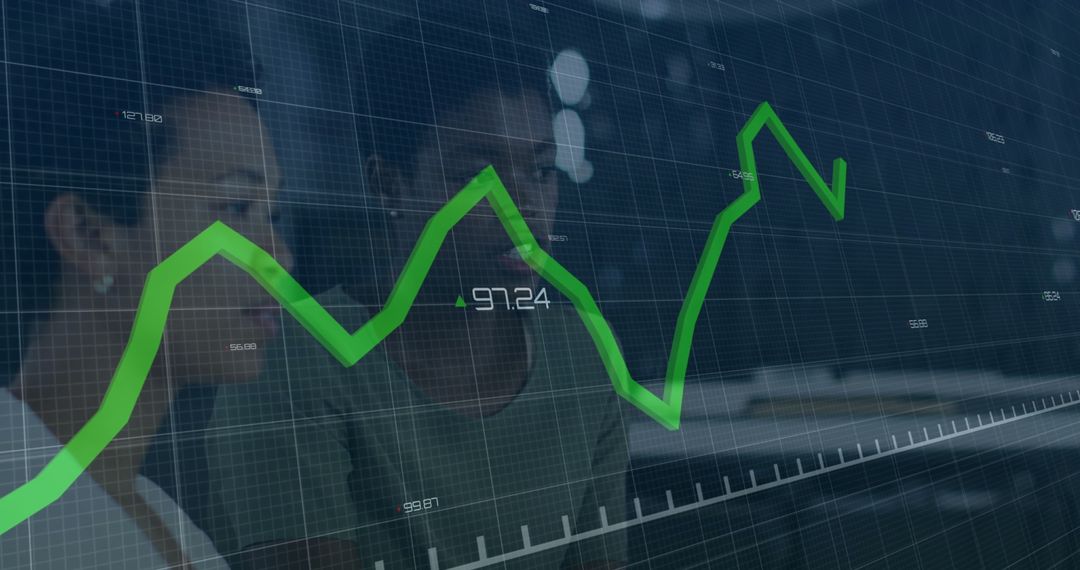
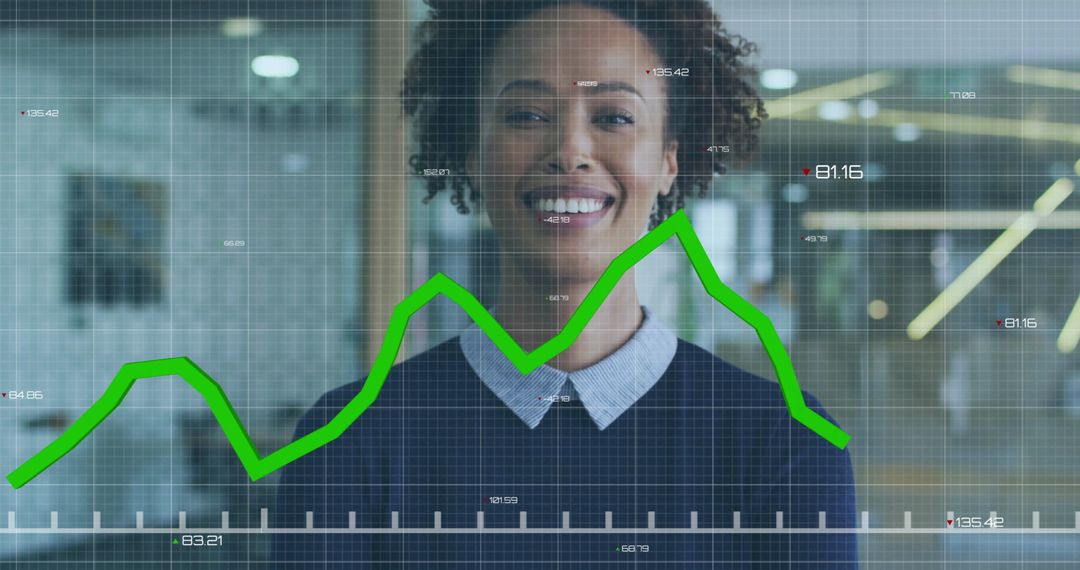
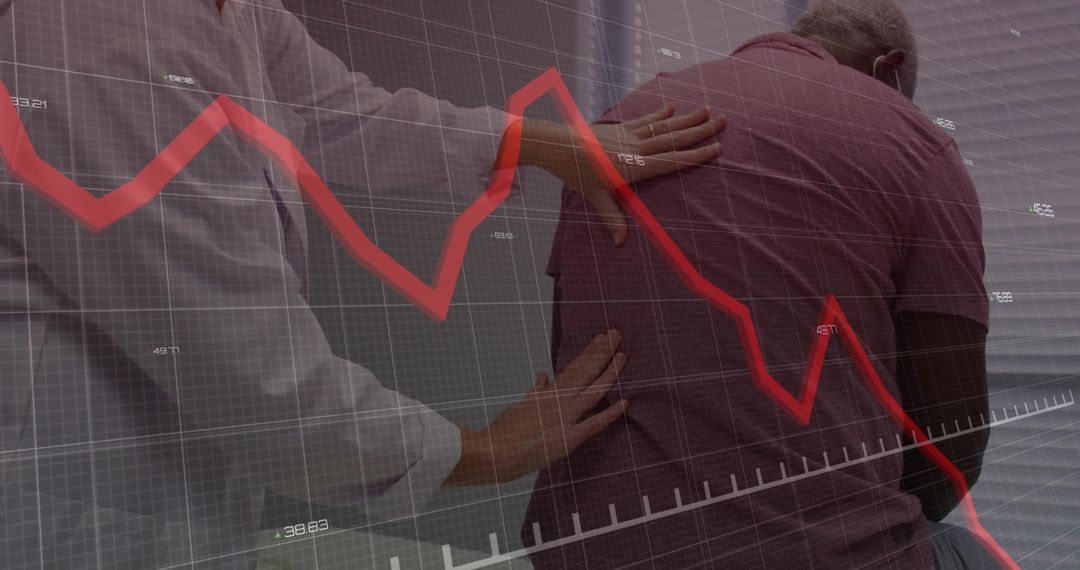
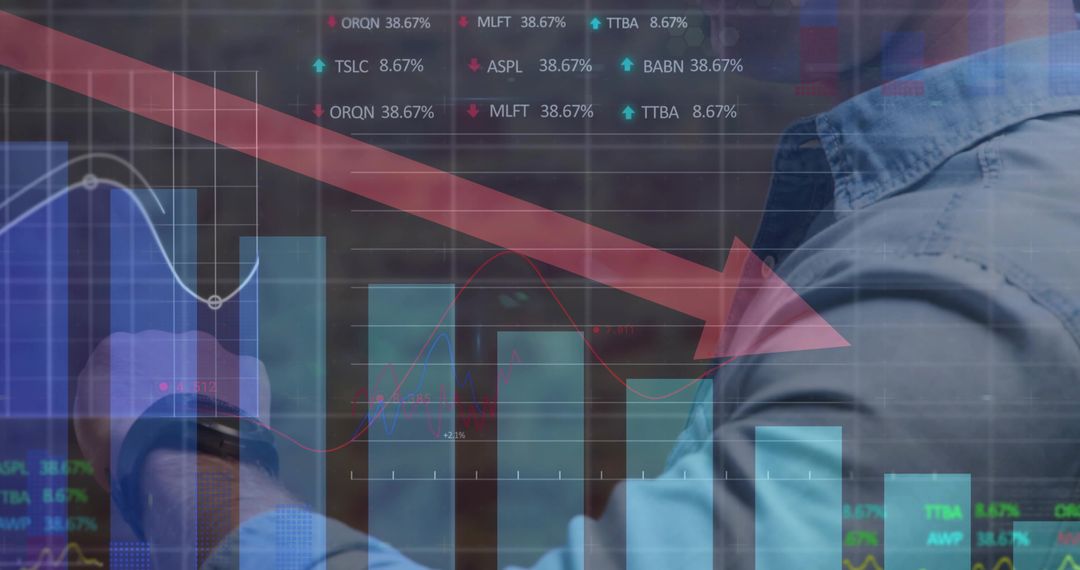
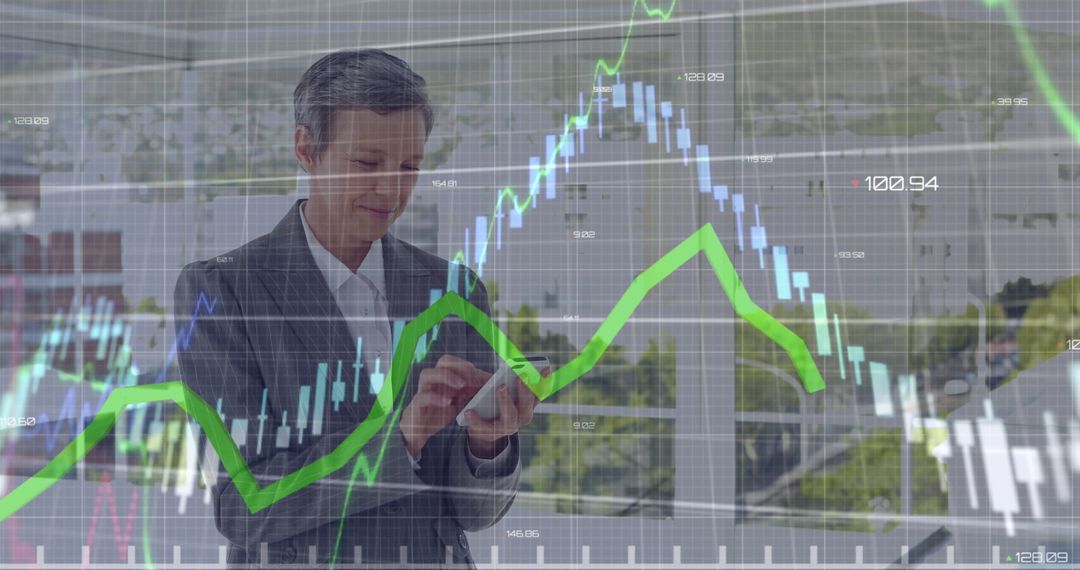
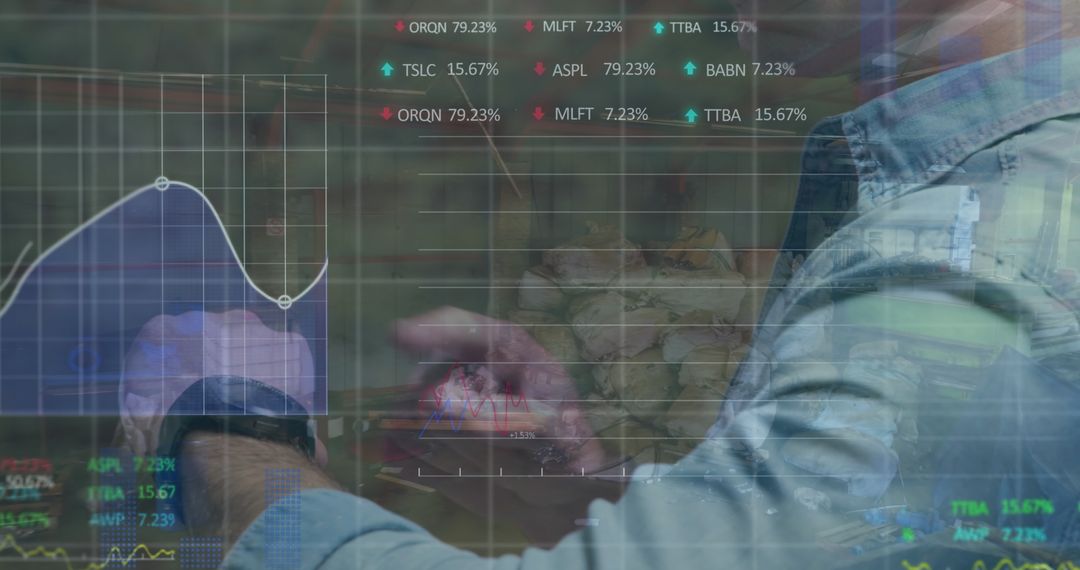
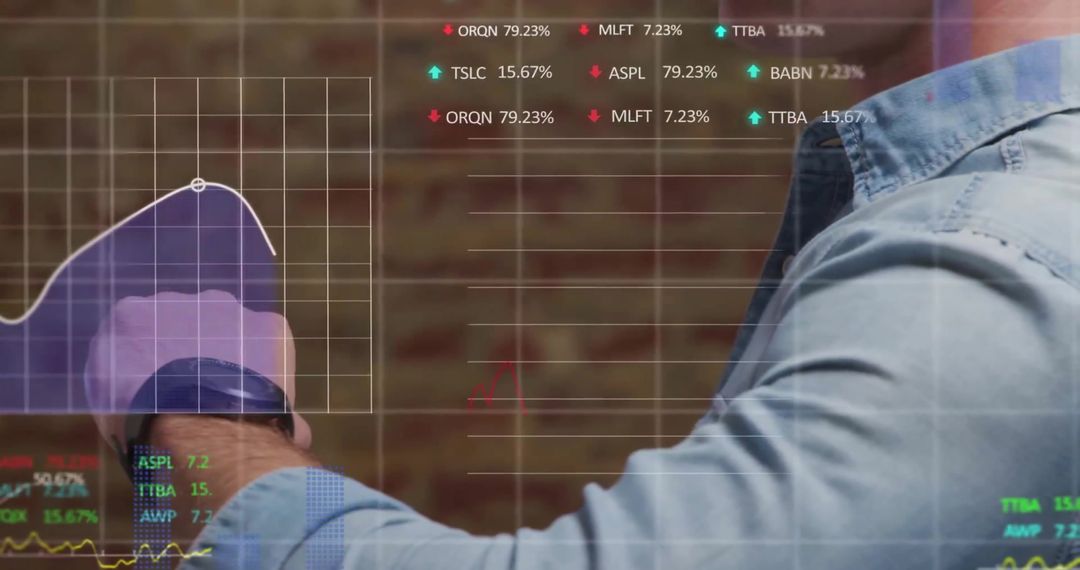
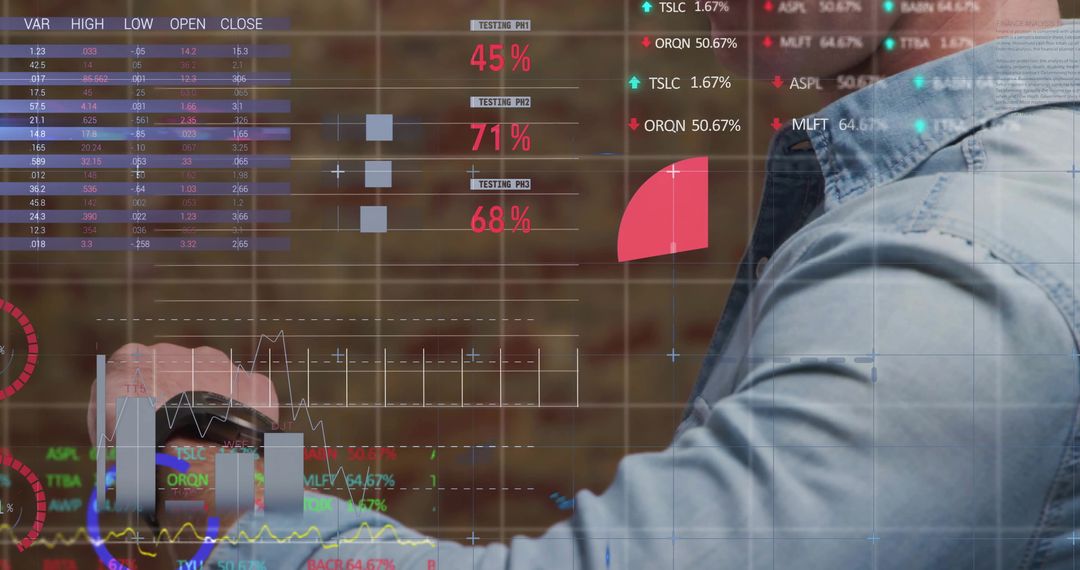
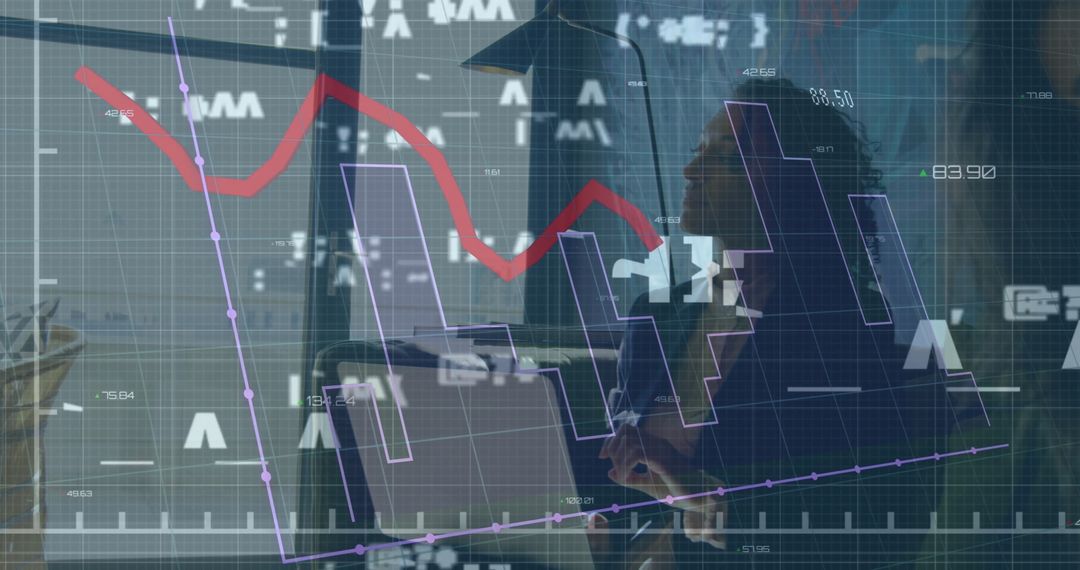
- Businessman Analyzing Data with Stock Market Decline Graph
Businessman Analyzing Data with Stock Market Decline Graph Image
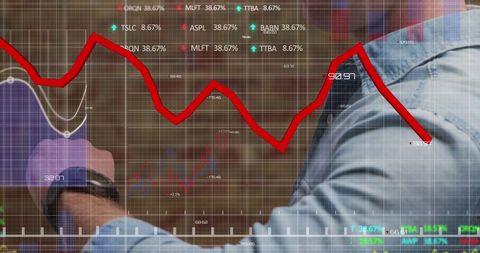
Man viewing stock market data with smartwatch amid declining graphs symbolizes modern financial monitoring and economic trends. Useful for illustrating finance news articles, global economy analysis presentations, or technology trends impacting business environments.
Powered by 


2
downloads
downloads
Tags:
More
Credit Photo
If you would like to credit the Photo, here are some ways you can do so
Text Link
photo Link
<span class="text-link">
<span>
<a target="_blank" href=https://pikwizard.com/photo/businessman-analyzing-data-with-stock-market-decline-graph/fe72713633cf2ea2f61d90e380d3b6af/>PikWizard</a>
</span>
</span>
<span class="image-link">
<span
style="margin: 0 0 20px 0; display: inline-block; vertical-align: middle; width: 100%;"
>
<a
target="_blank"
href="https://pikwizard.com/photo/businessman-analyzing-data-with-stock-market-decline-graph/fe72713633cf2ea2f61d90e380d3b6af/"
style="text-decoration: none; font-size: 10px; margin: 0;"
>
<img src="https://pikwizard.com/pw/medium/fe72713633cf2ea2f61d90e380d3b6af.jpg" style="margin: 0; width: 100%;" alt="" />
<p style="font-size: 12px; margin: 0;">PikWizard</p>
</a>
</span>
</span>
Free (free of charge)
Free for personal and commercial use.
Author: Authentic Images
Similar Free Stock Images

Premium


Premium


Premium


Premium


Premium


Premium


Premium


Premium


Premium


Premium


Premium


Premium


Premium


Premium


Premium


Premium


Premium


Premium


Premium


Premium


Premium


Premium


Premium


Premium