- Home >
- Stock Photos >
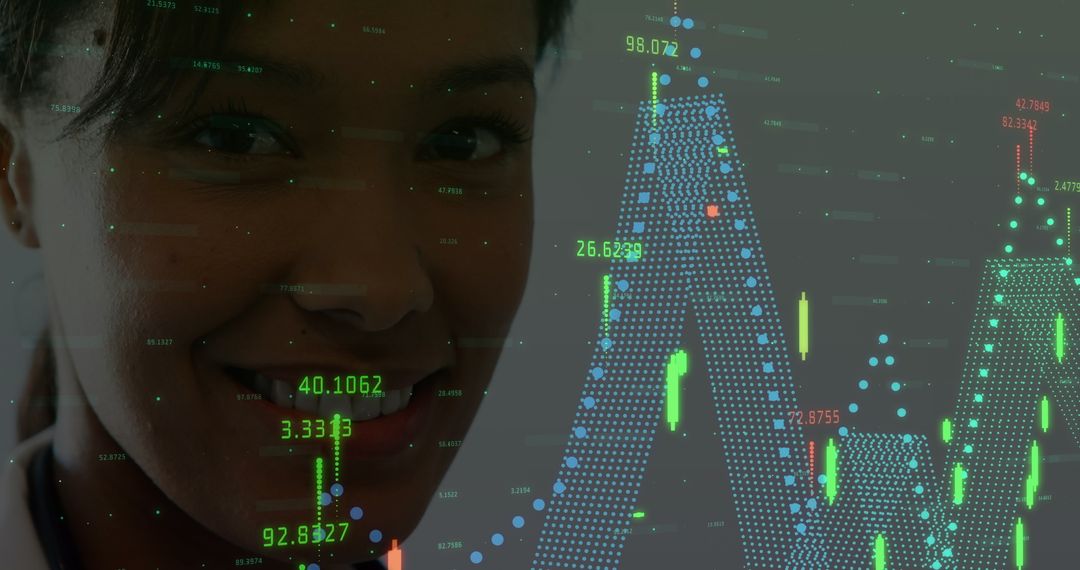
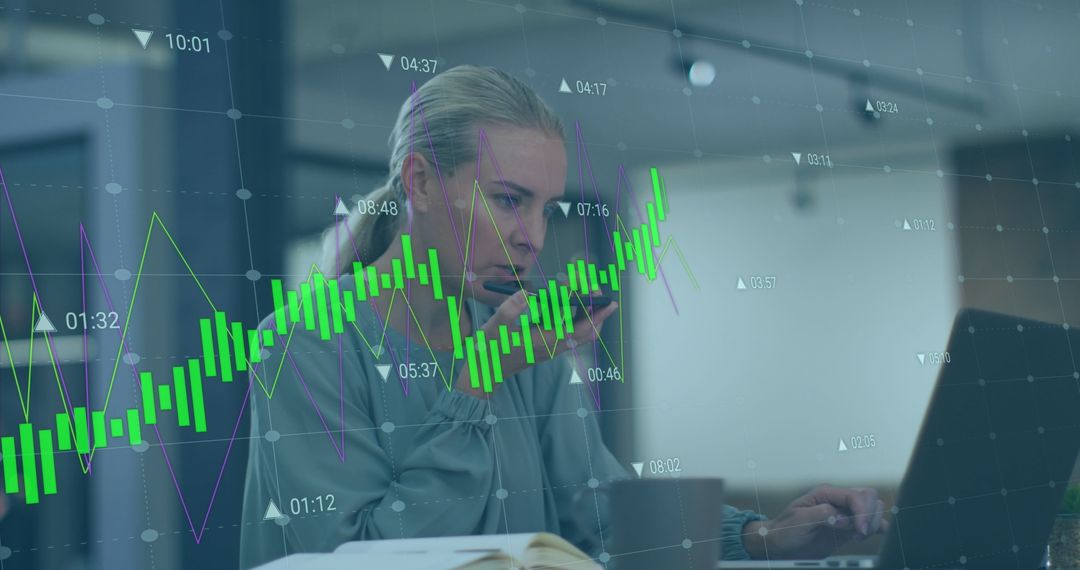
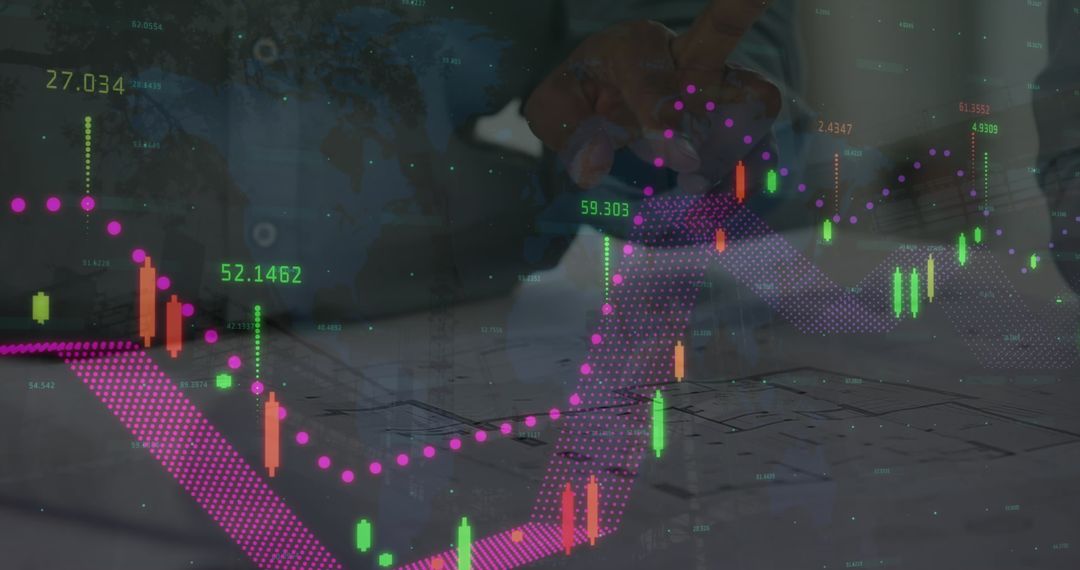
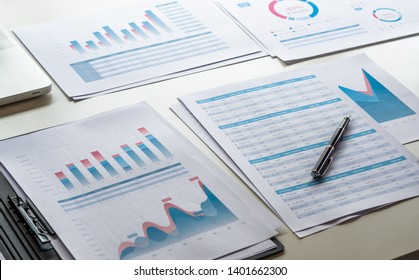
- Businessman Analyzing Financial Data with Charts Overlay
Businessman Analyzing Financial Data with Charts Overlay Image

The image depicts an Asian businessman focused on detailed papers while digital financial data graphs are overlaid. This represents a modern approach to finance and data analysis. Useful for illustrating concepts in financial analysis, business technology trends, or data-driven decision making.
Powered by  - Get 15% off with code: PIKWIZARD15


4
downloads
downloads
Tags:
More
Credit Photo
If you would like to credit the Photo, here are some ways you can do so
Text Link
photo Link
<span class="text-link">
<span>
<a target="_blank" href=https://pikwizard.com/photo/businessman-analyzing-financial-data-with-charts-overlay/d976e82bc483281a9faaa668525d2182/>PikWizard</a>
</span>
</span>
<span class="image-link">
<span
style="margin: 0 0 20px 0; display: inline-block; vertical-align: middle; width: 100%;"
>
<a
target="_blank"
href="https://pikwizard.com/photo/businessman-analyzing-financial-data-with-charts-overlay/d976e82bc483281a9faaa668525d2182/"
style="text-decoration: none; font-size: 10px; margin: 0;"
>
<img src="https://pikwizard.com/pw/medium/d976e82bc483281a9faaa668525d2182.jpg" style="margin: 0; width: 100%;" alt="" />
<p style="font-size: 12px; margin: 0;">PikWizard</p>
</a>
</span>
</span>
Free (free of charge)
Free for personal and commercial use.
Author: Awesome Content
Similar Free Stock Images

Premium


Premium


Premium


Premium


Premium


Premium


Premium


Premium


Premium


Premium


Premium


Premium


Premium


Premium


Premium


Premium


Premium


Premium


Premium


Premium


Premium


Premium


Premium


Premium