- Home >
- Stock Photos >
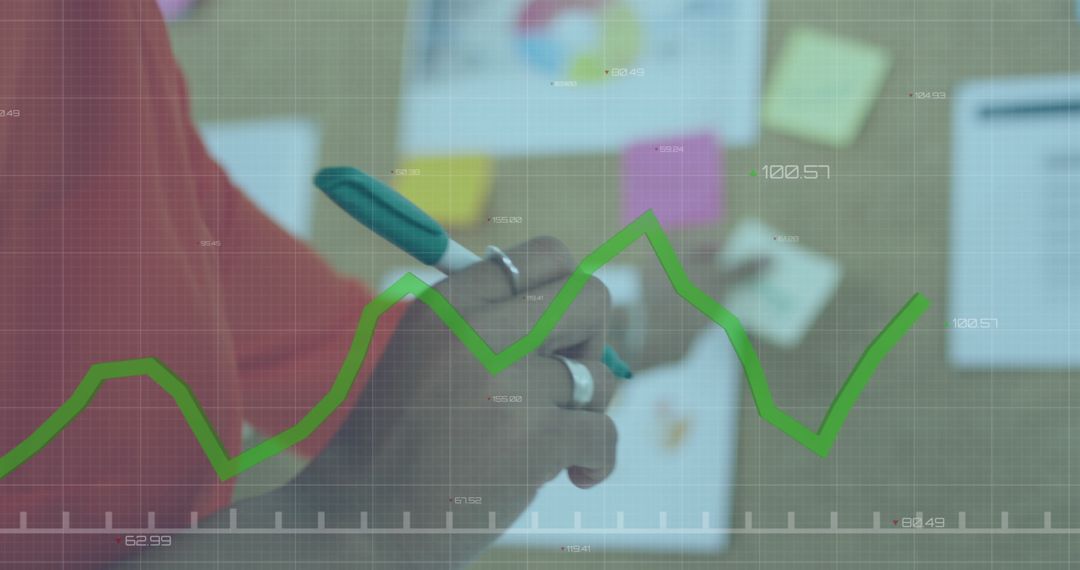
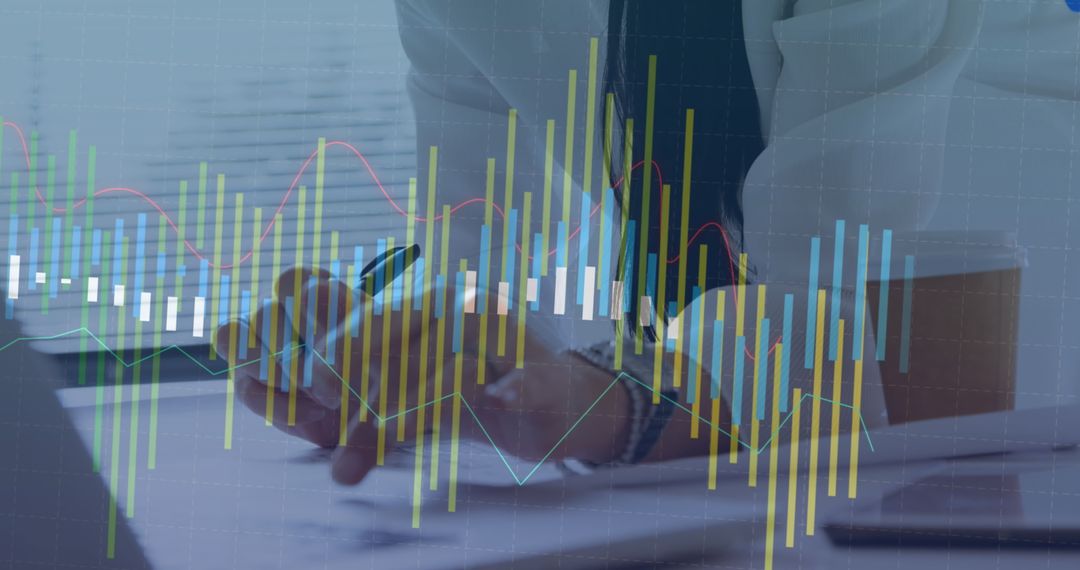
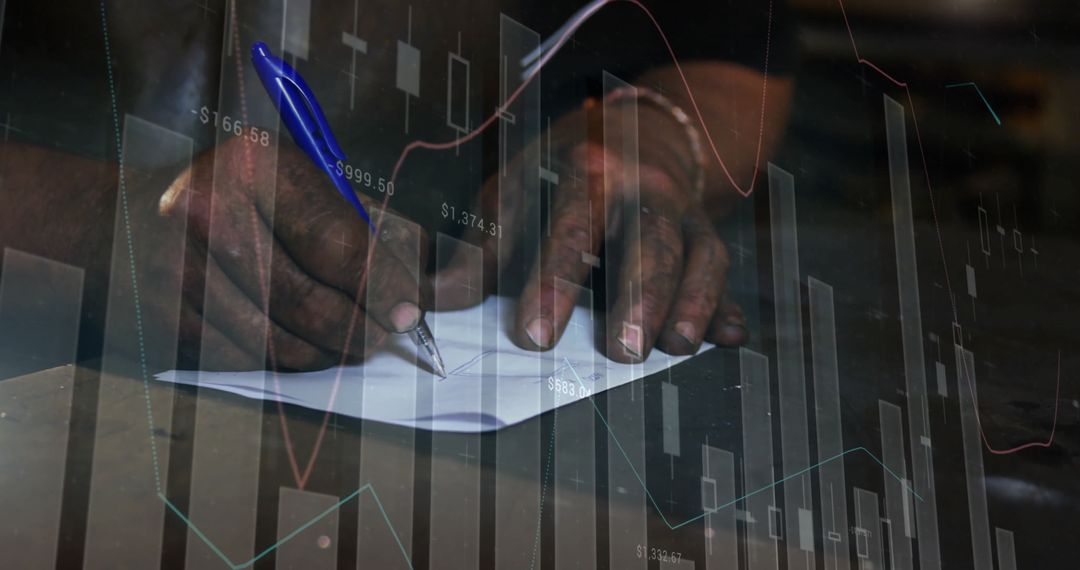
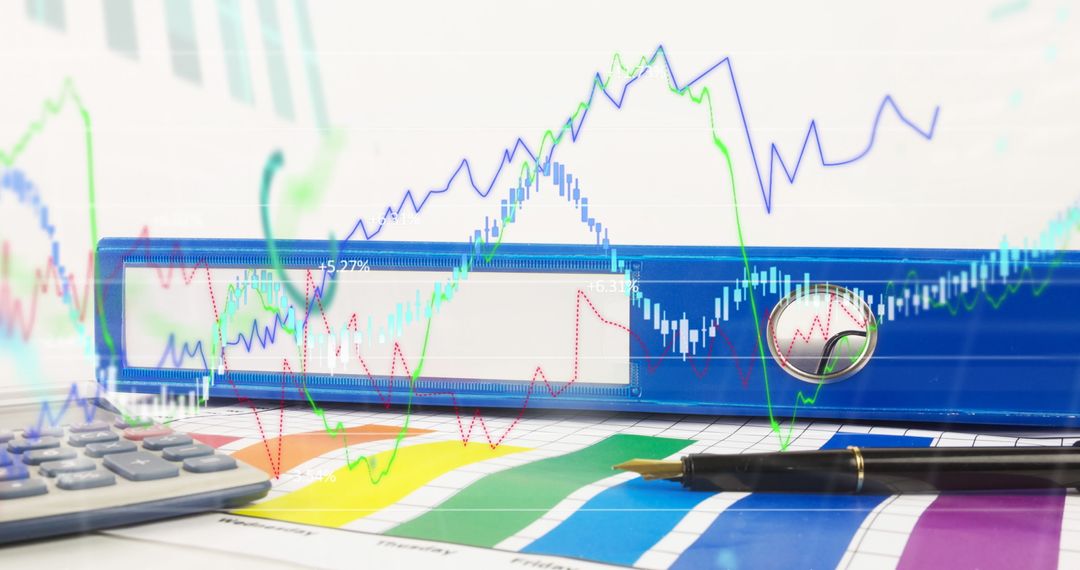
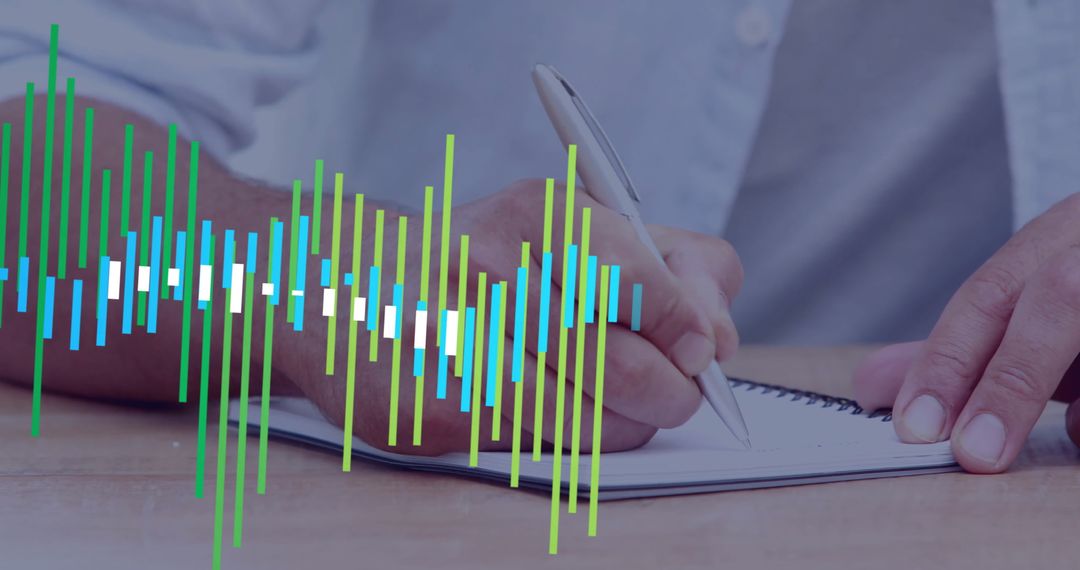
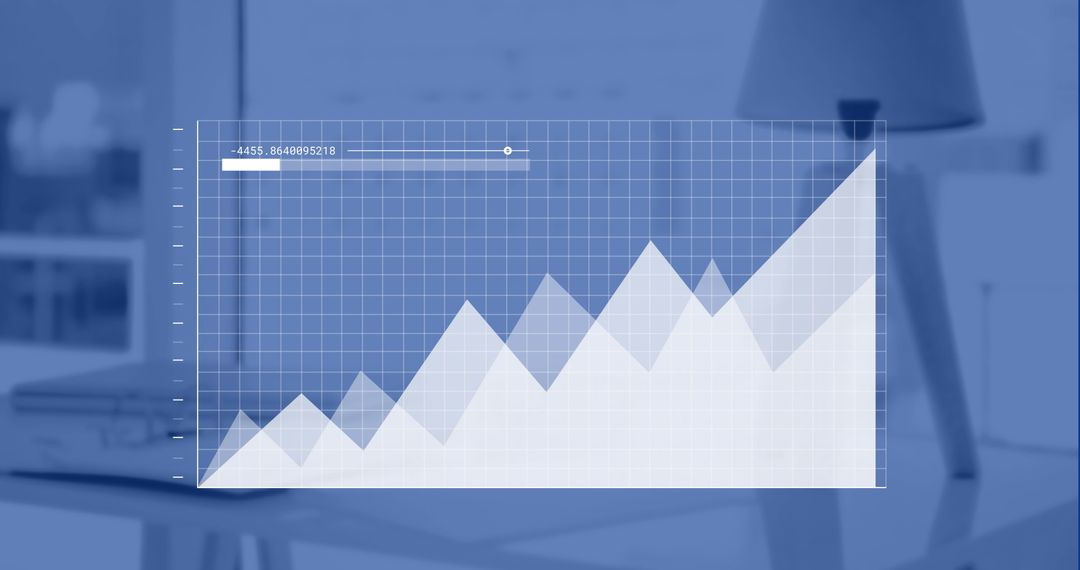
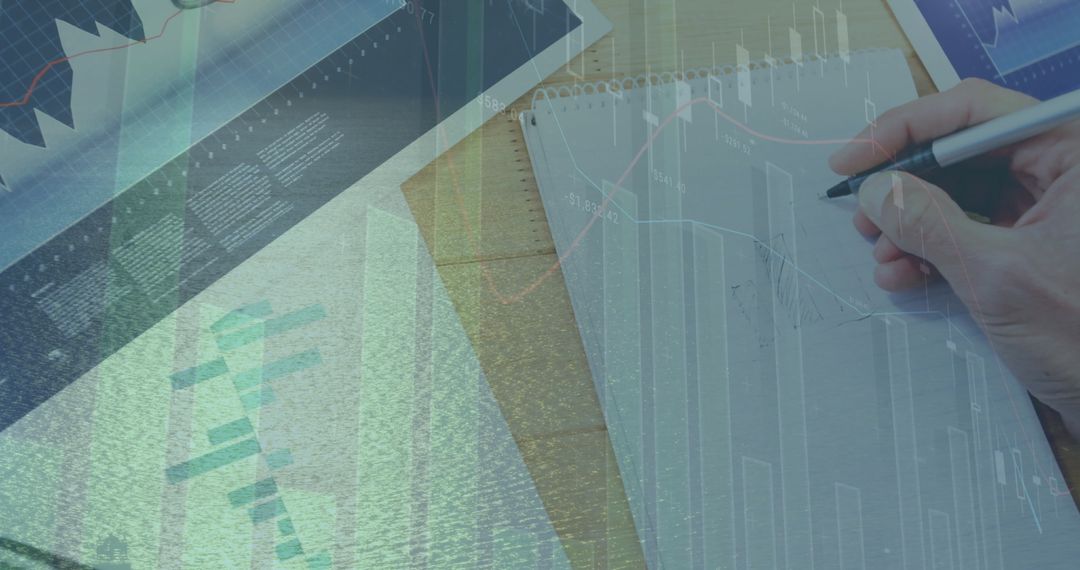
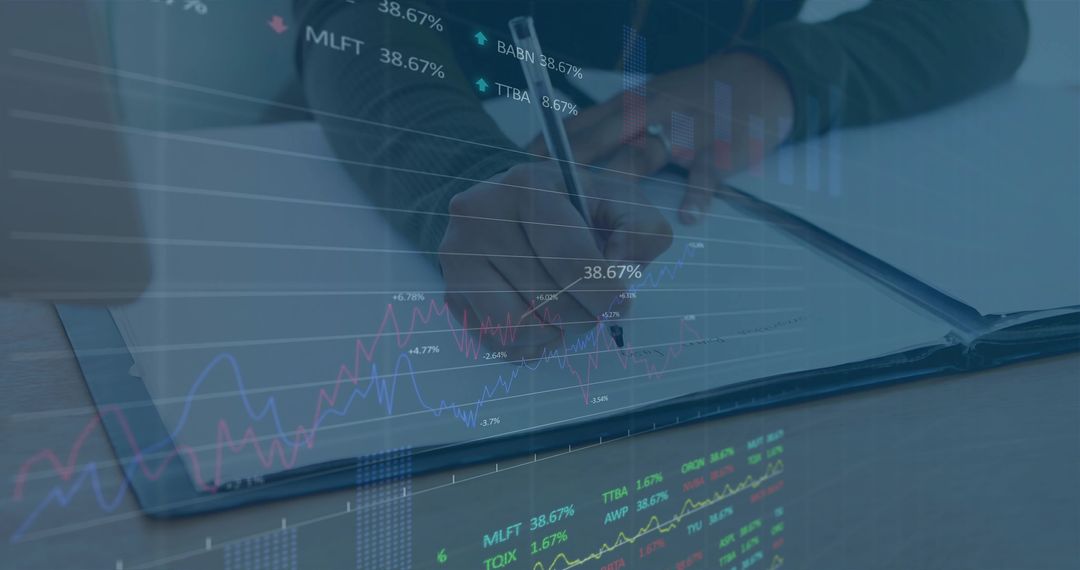
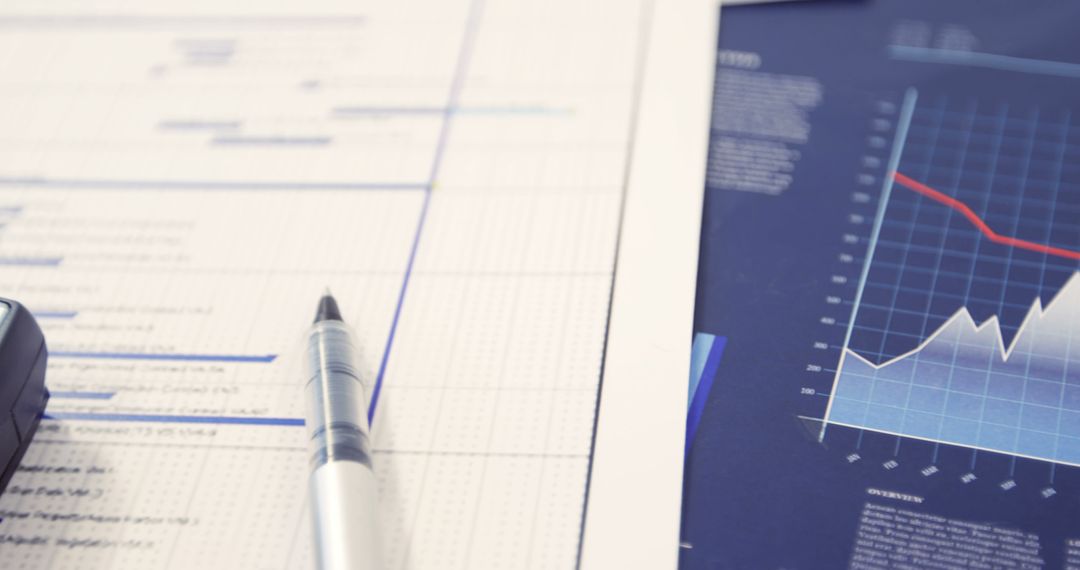
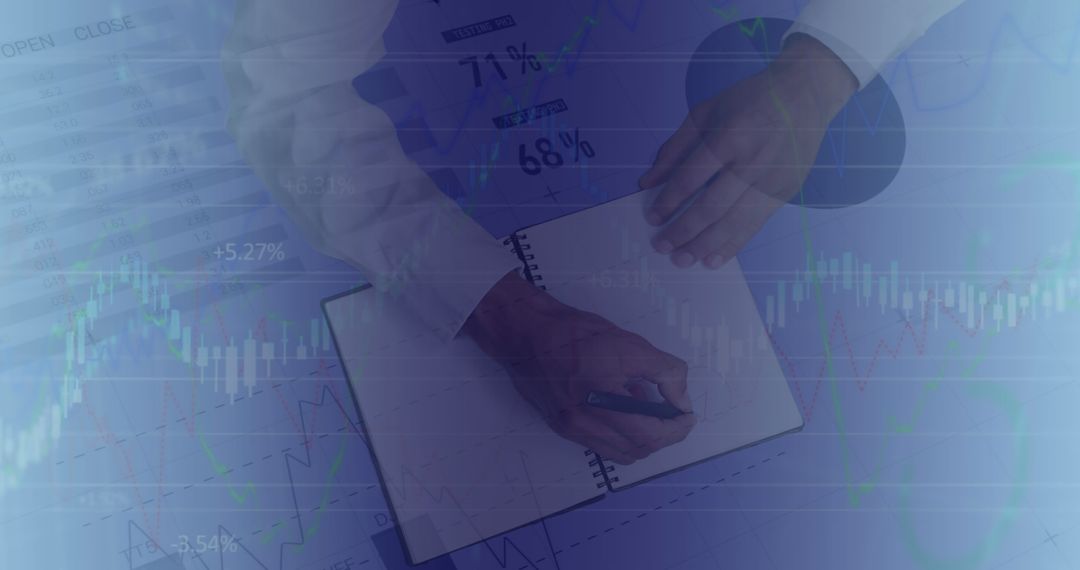
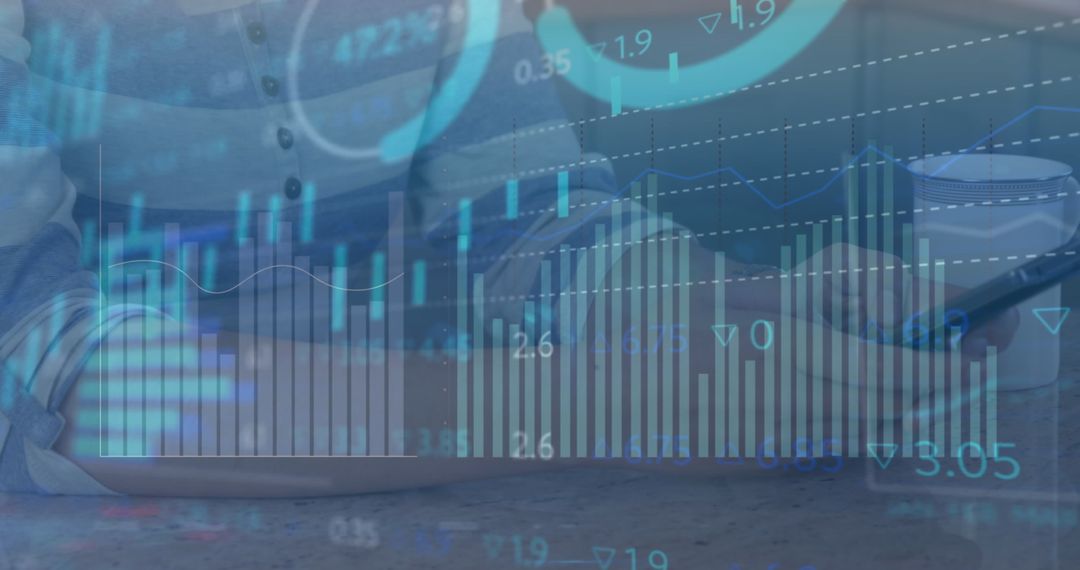
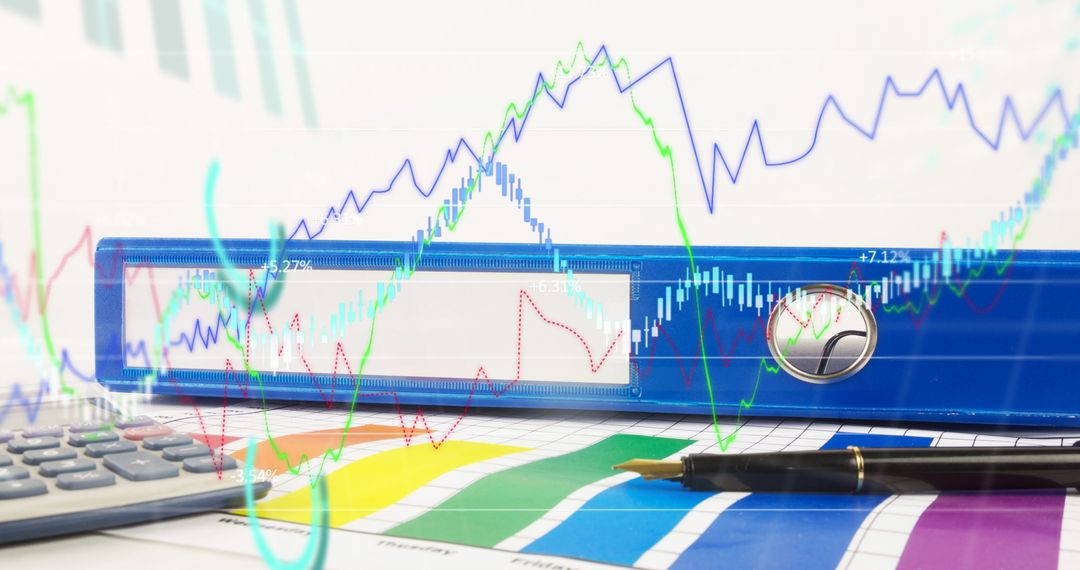
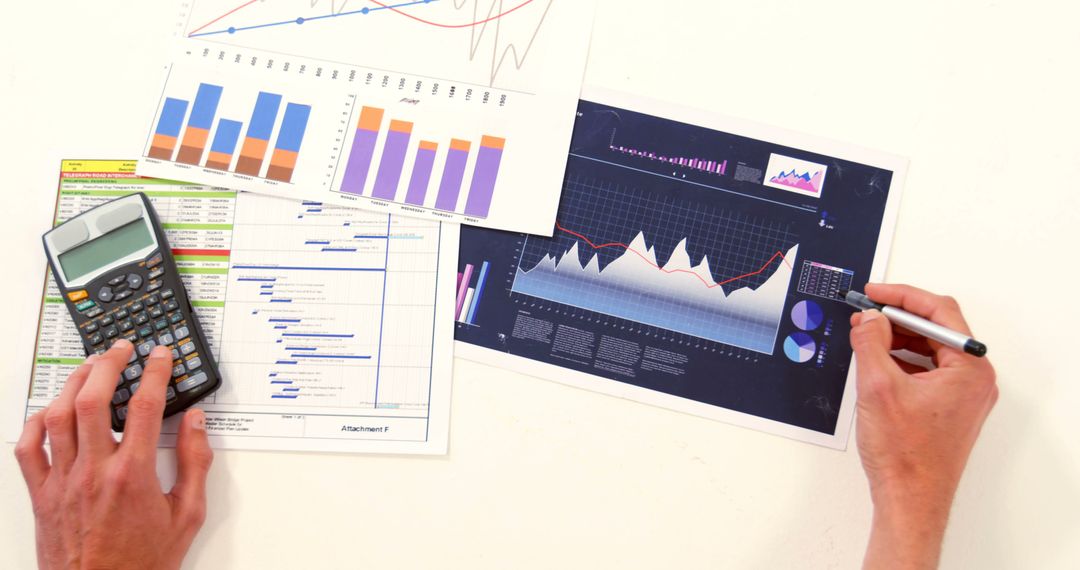
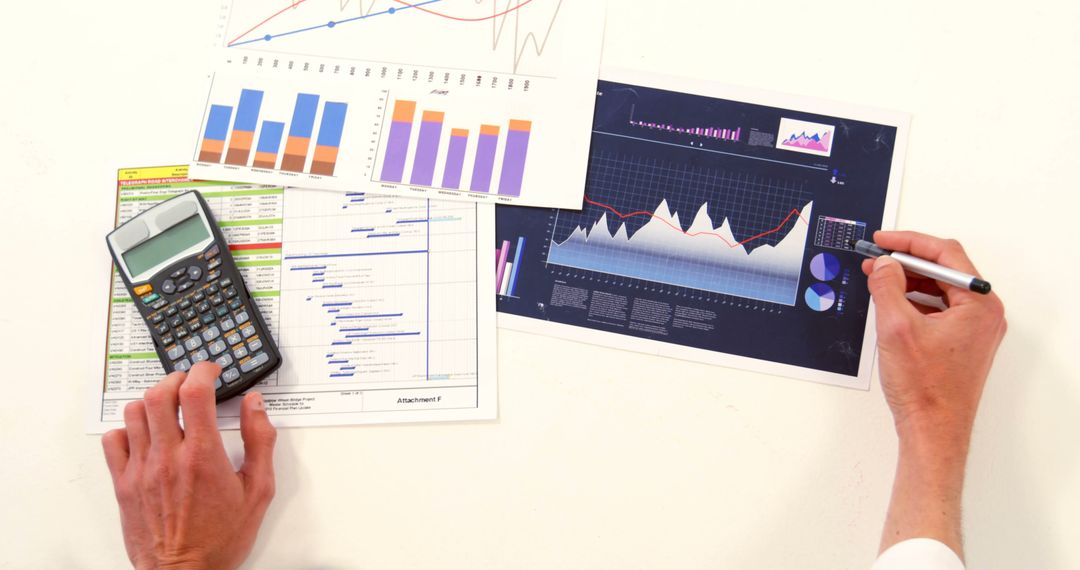
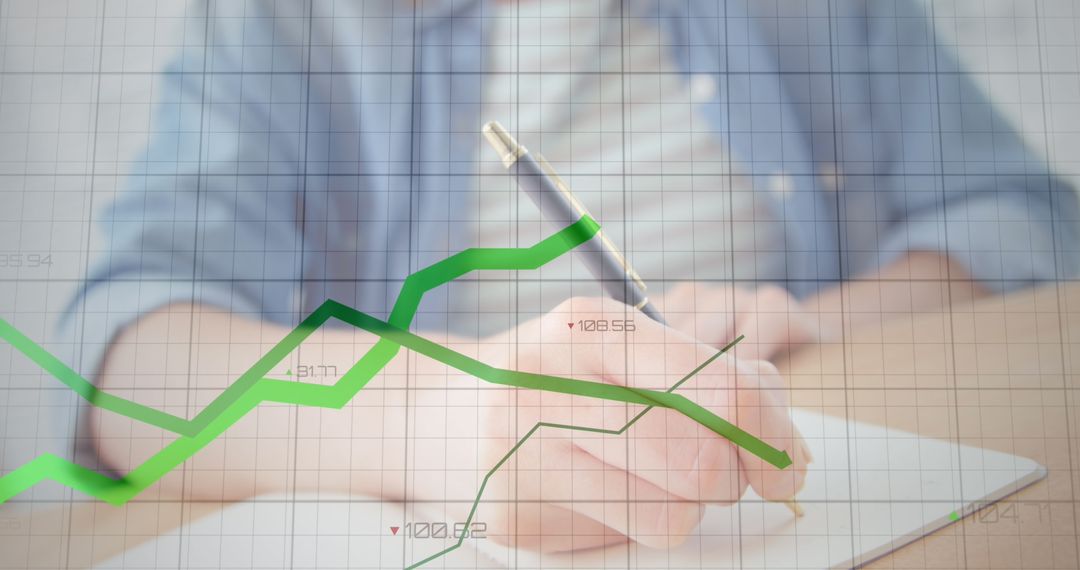
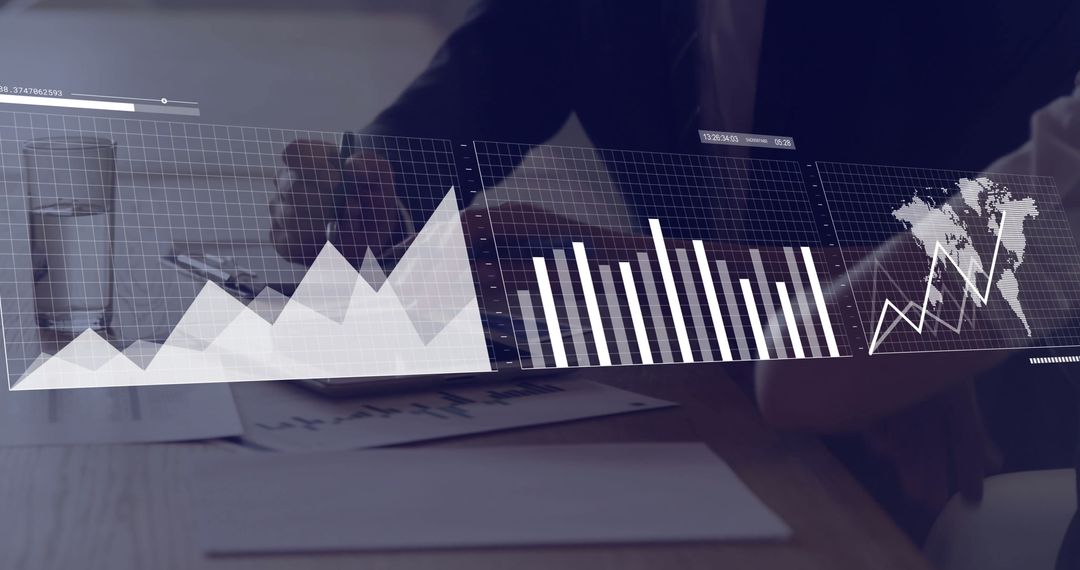
- Businessman Analyzing Financial Data with Graphs and Charts
Businessman Analyzing Financial Data with Graphs and Charts Image
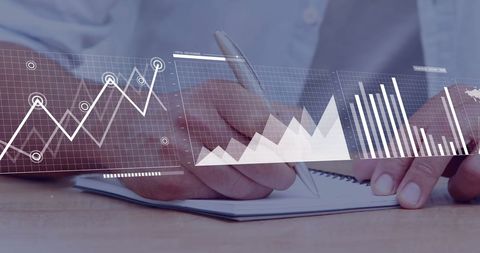
Businessman is actively reviewing and taking notes on financial data, represented by overlaid graphs and charts. Perfect for illustrating themes related to business analysis, finance, technology integration in modern offices, and market trends. Ideal for use in business presentations, finance publications, or digital marketing.
Powered by  - Get 15% off with code: PIKWIZARD15


0
downloads
downloads
Tags:
More
Credit Photo
If you would like to credit the Photo, here are some ways you can do so
Text Link
photo Link
<span class="text-link">
<span>
<a target="_blank" href=https://pikwizard.com/photo/businessman-analyzing-financial-data-with-graphs-and-charts/af455f17fa13b3c5c70e52f276488fe3/>PikWizard</a>
</span>
</span>
<span class="image-link">
<span
style="margin: 0 0 20px 0; display: inline-block; vertical-align: middle; width: 100%;"
>
<a
target="_blank"
href="https://pikwizard.com/photo/businessman-analyzing-financial-data-with-graphs-and-charts/af455f17fa13b3c5c70e52f276488fe3/"
style="text-decoration: none; font-size: 10px; margin: 0;"
>
<img src="https://pikwizard.com/pw/medium/af455f17fa13b3c5c70e52f276488fe3.jpg" style="margin: 0; width: 100%;" alt="" />
<p style="font-size: 12px; margin: 0;">PikWizard</p>
</a>
</span>
</span>
Free (free of charge)
Free for personal and commercial use.
Author: Authentic Images
Similar Free Stock Images

Premium


Premium


Premium


Premium


Premium


Premium


Premium


Premium


Premium


Premium


Premium


Premium


Premium


Premium


Premium


Premium


Premium


Premium


Premium


Premium


Premium


Premium


Premium


Premium