- Home >
- Stock Photos >
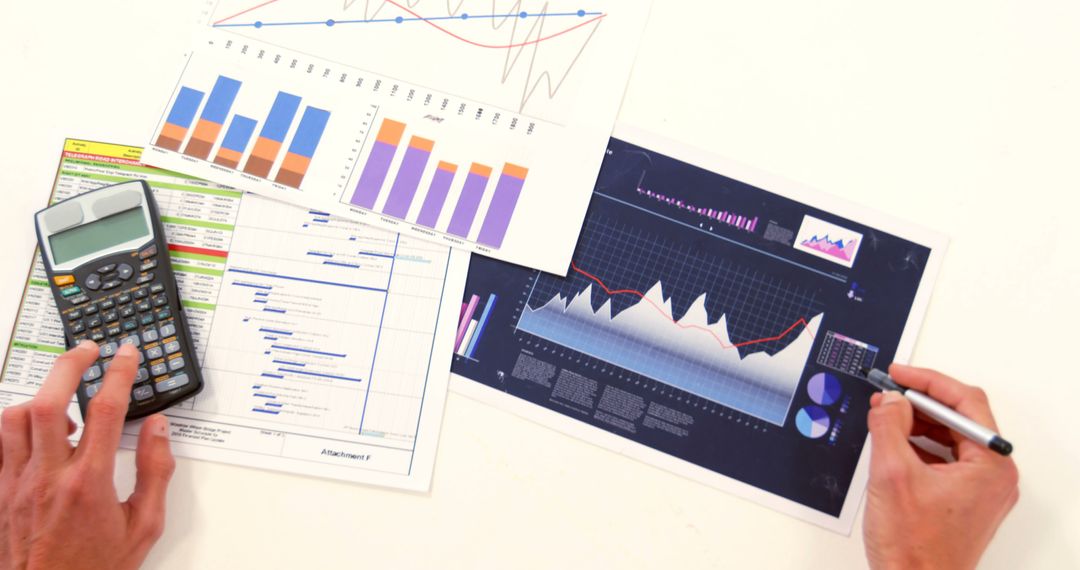
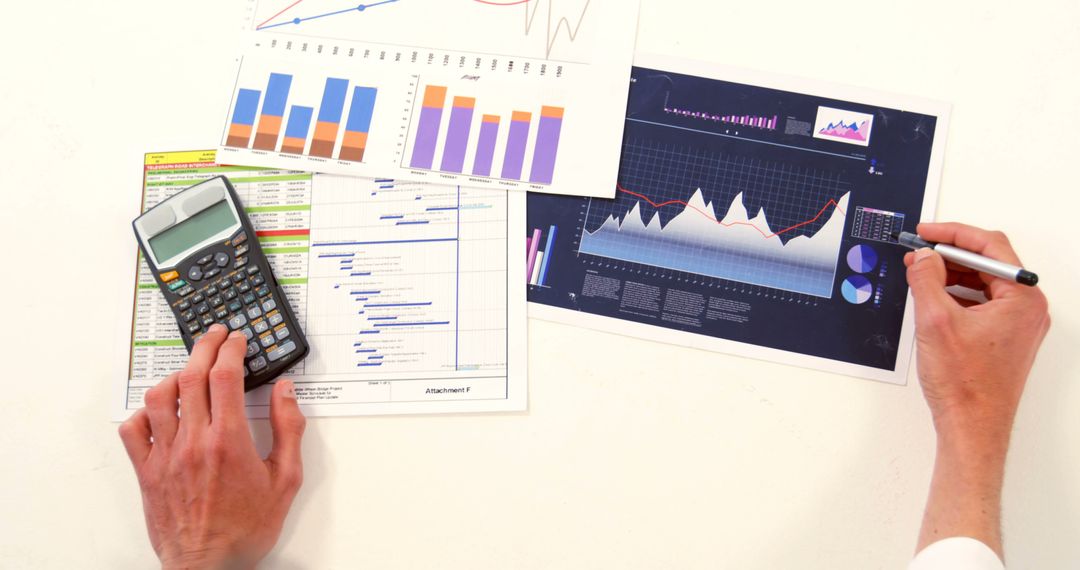
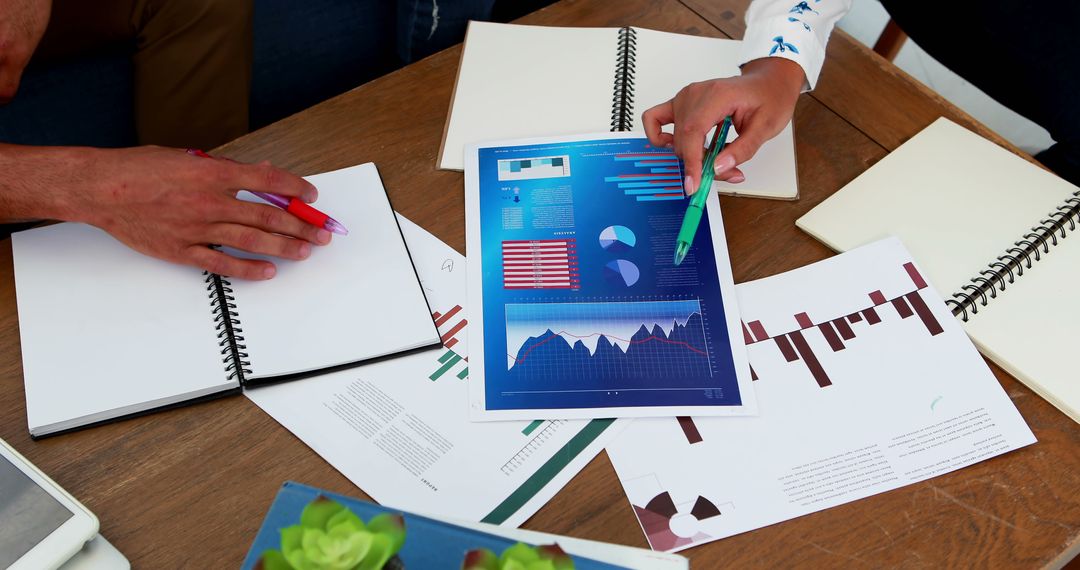
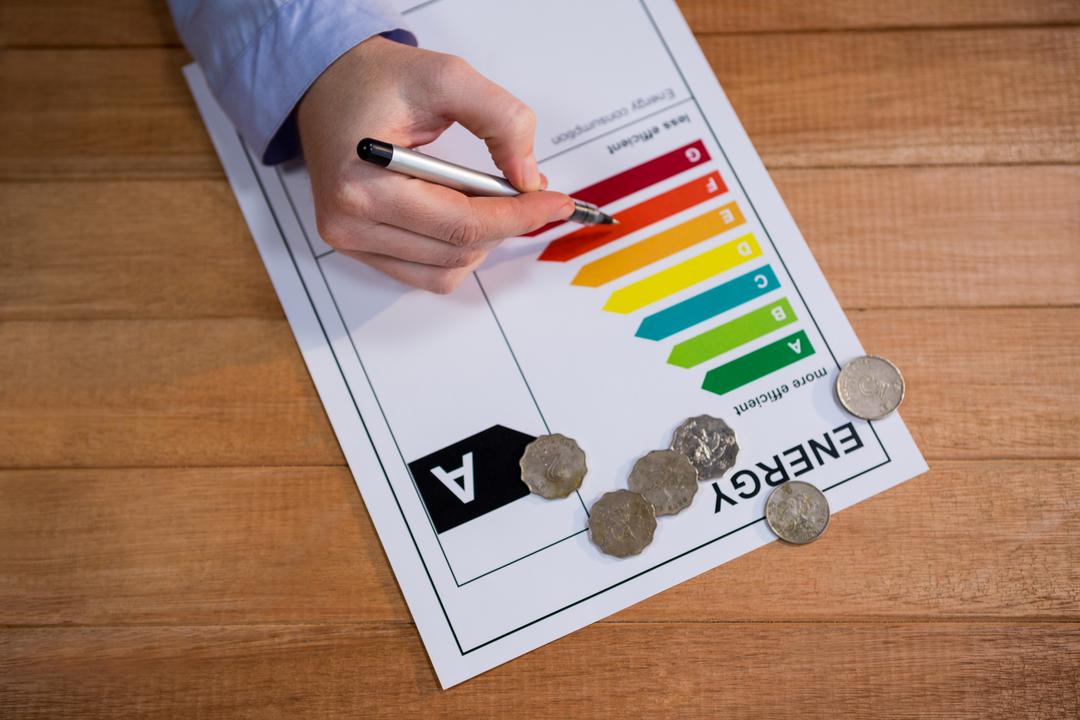
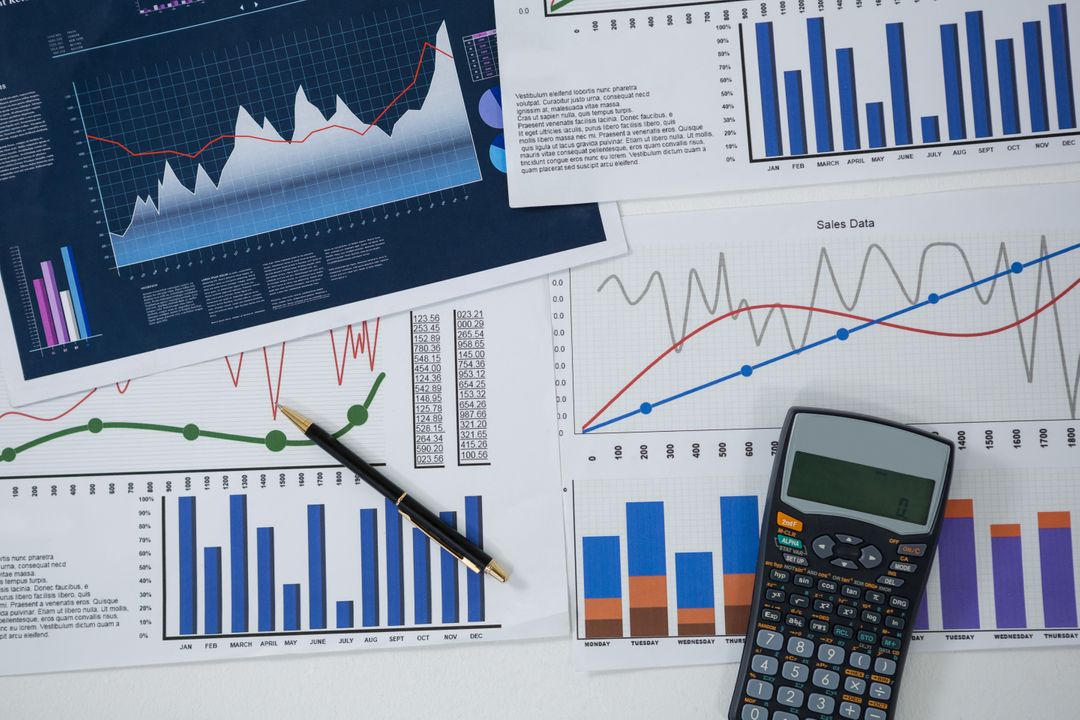
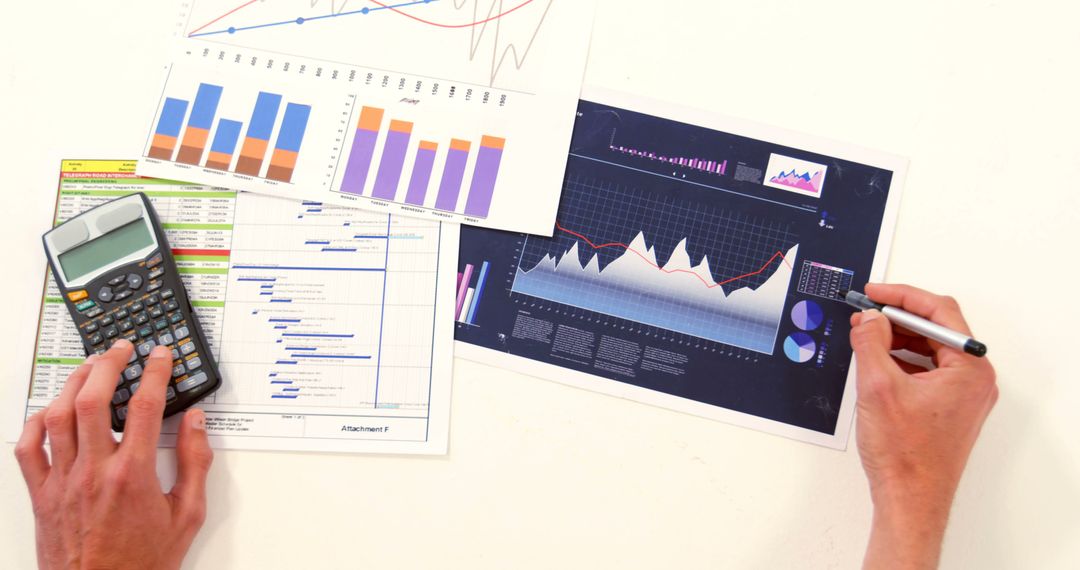
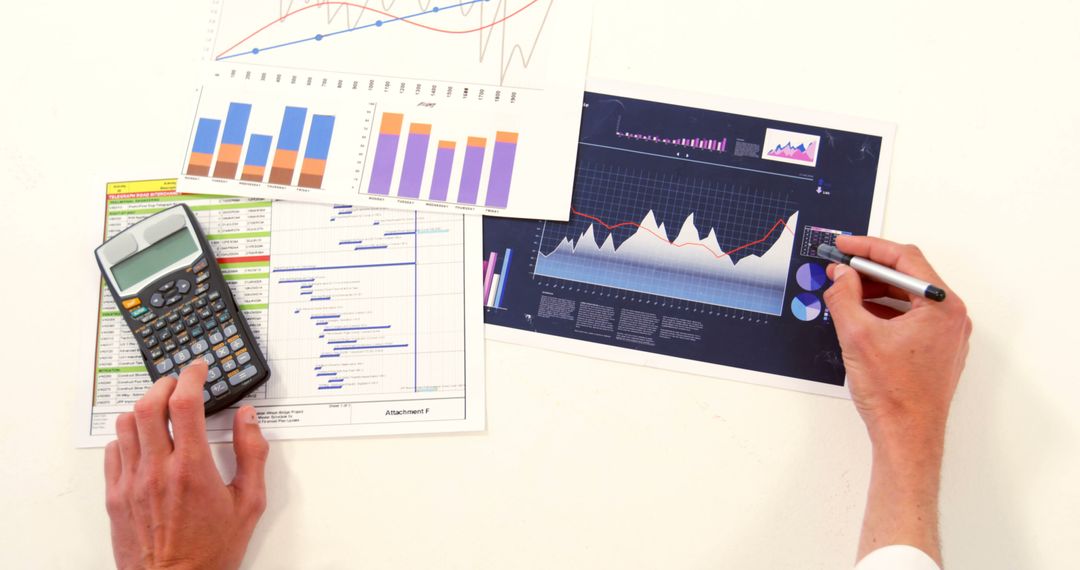
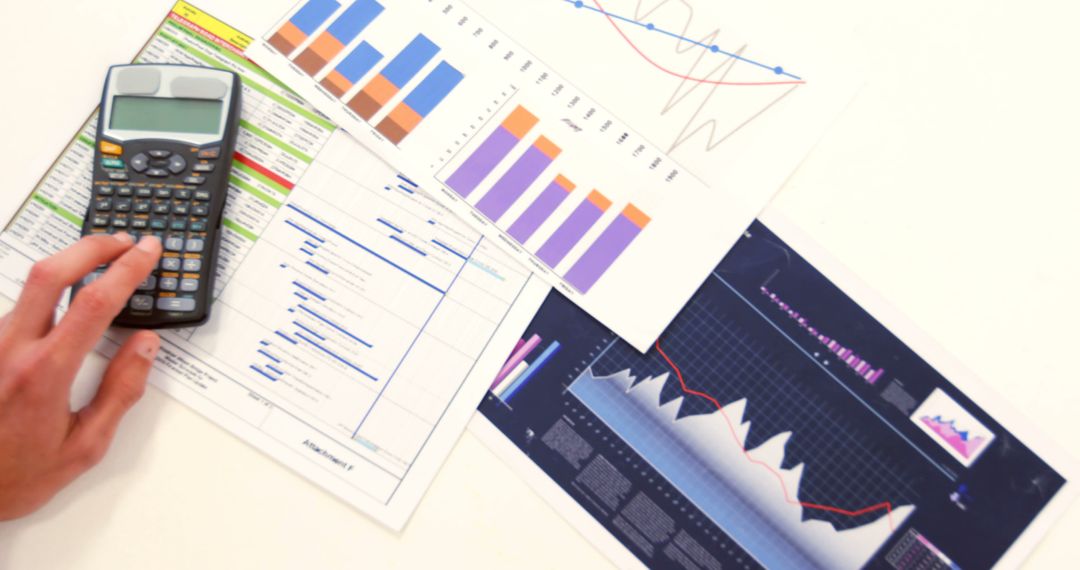
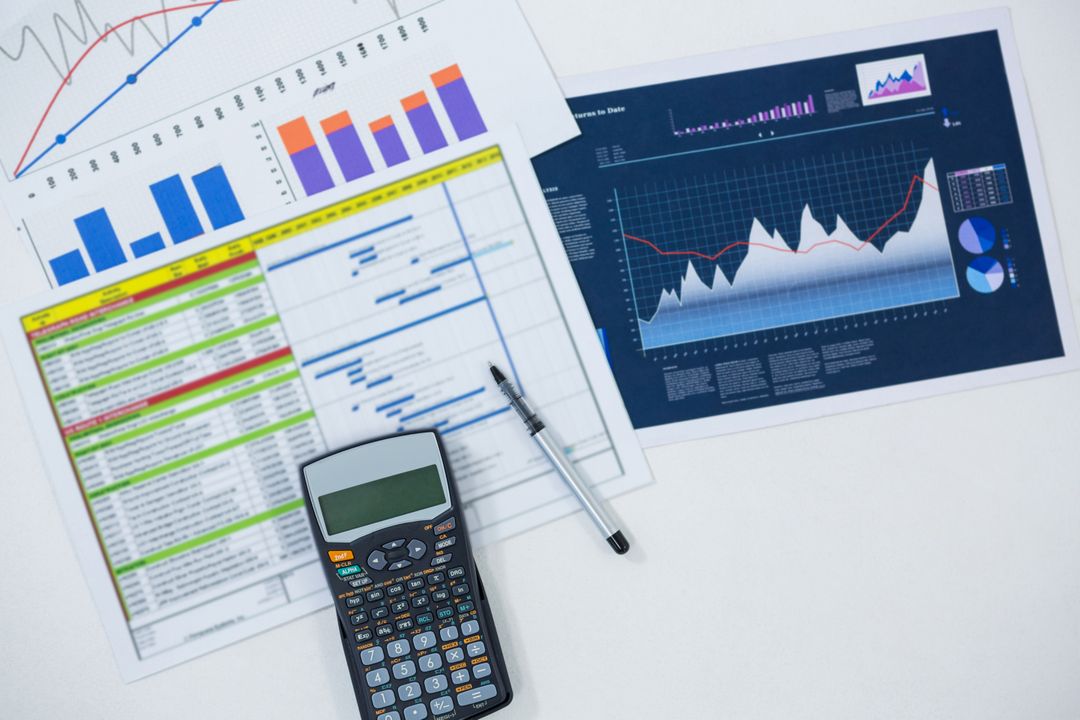
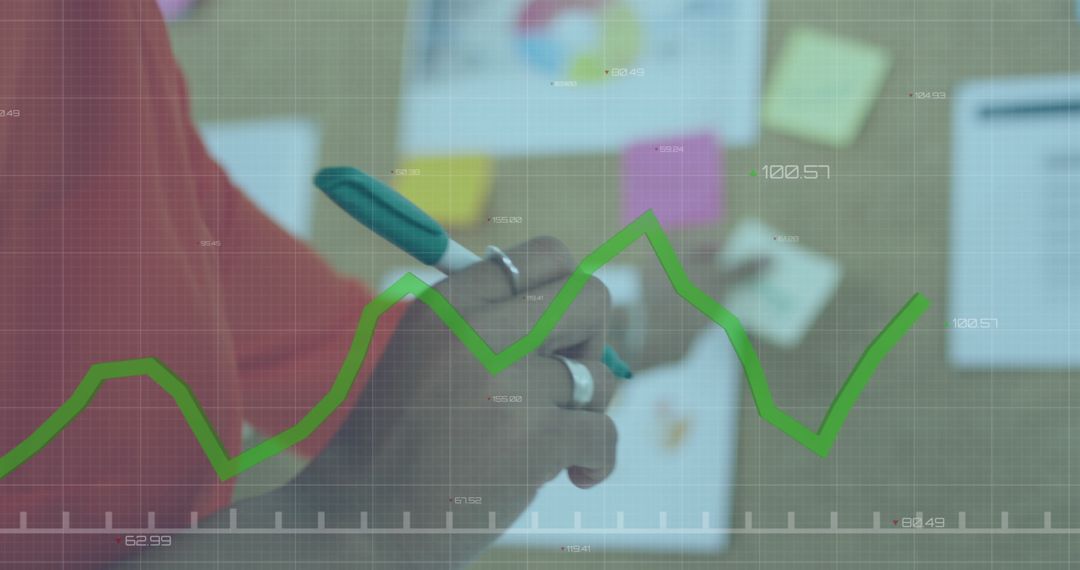
- Businessman Analyzing Financial Graphs and Calculator
Businessman Analyzing Financial Graphs and Calculator Image
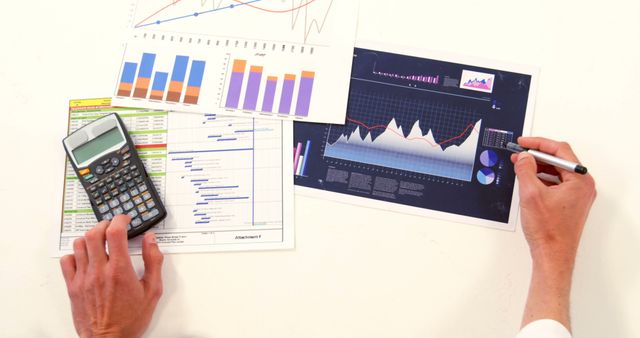
Business professional examining financial graphs and using a calculator for analysis. Ideal for themes involving financial management, business strategy, corporate analysis, and data-driven decision-making.
Powered by  - Get 15% off with code: PIKWIZARD15


Credit Photo
If you would like to credit the Photo, here are some ways you can do so
Text Link
photo Link
<span class="text-link">
<span>
<a target="_blank" href=https://pikwizard.com/photo/businessman-analyzing-financial-graphs-and-calculator/f77b67b843e3fb876ad7628ed5028905/>PikWizard</a>
</span>
</span>
<span class="image-link">
<span
style="margin: 0 0 20px 0; display: inline-block; vertical-align: middle; width: 100%;"
>
<a
target="_blank"
href="https://pikwizard.com/photo/businessman-analyzing-financial-graphs-and-calculator/f77b67b843e3fb876ad7628ed5028905/"
style="text-decoration: none; font-size: 10px; margin: 0;"
>
<img src="https://pikwizard.com/pw/medium/f77b67b843e3fb876ad7628ed5028905.jpg" style="margin: 0; width: 100%;" alt="" />
<p style="font-size: 12px; margin: 0;">PikWizard</p>
</a>
</span>
</span>
Free (free of charge)
Free for personal and commercial use.
Author: Authentic Images
Similar Free Stock Images

Premium


Premium


Premium


Premium


Premium


Premium


Premium


Premium


Premium


Premium


Premium


Premium


Premium


Premium


Premium


Premium


Premium


Premium


Premium


Premium


Premium


Premium


Premium


Premium