- Home >
- Stock Photos >
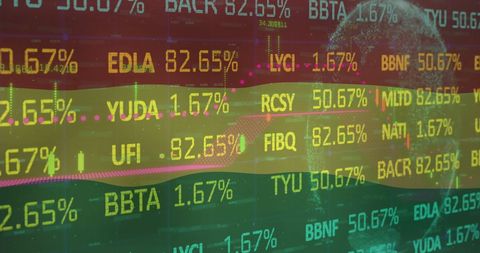
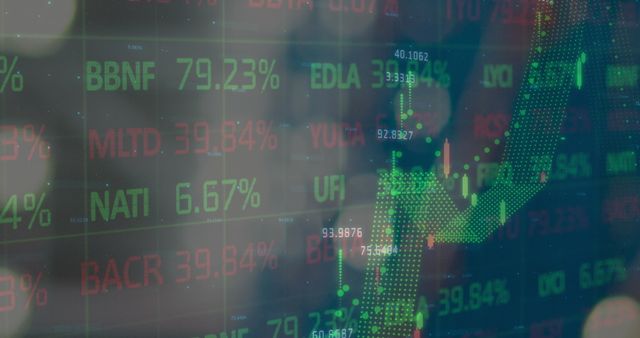
- Businessman Analyzing Global Market Data with Futuristic Holographic Trading Dashboard
Businessman Analyzing Global Market Data with Futuristic Holographic Trading Dashboard Image

Businessman in suit analyzing global market data through holographic HUD overlay showing world map and multicolored stock tickers, creating dynamic futuristic finance concept and offering ample space for text and branding. Works well for fintech websites, financial reports, corporate presentations, investor relations materials, marketing campaigns, blog headers, social media ads, and slide decks covering market trends, trading strategy, or data analytics. Suitable as hero background, banner, or layered composition, supporting color grading and text overlays, and helping communicate innovation, global markets, and business intelligence.
Powered by  - Get 15% off with code: PIKWIZARD15


0
downloads
downloads
Tags:
More
Credit Photo
If you would like to credit the Photo, here are some ways you can do so
Text Link
photo Link
<span class="text-link">
<span>
<a target="_blank" href=https://pikwizard.com/photo/businessman-analyzing-global-market-data-with-futuristic-holographic-trading-dashboard/850839742cd1e91f3a4a8655d1b2ddc5/>PikWizard</a>
</span>
</span>
<span class="image-link">
<span
style="margin: 0 0 20px 0; display: inline-block; vertical-align: middle; width: 100%;"
>
<a
target="_blank"
href="https://pikwizard.com/photo/businessman-analyzing-global-market-data-with-futuristic-holographic-trading-dashboard/850839742cd1e91f3a4a8655d1b2ddc5/"
style="text-decoration: none; font-size: 10px; margin: 0;"
>
<img src="https://pikwizard.com/pw/medium/850839742cd1e91f3a4a8655d1b2ddc5.jpg" style="margin: 0; width: 100%;" alt="" />
<p style="font-size: 12px; margin: 0;">PikWizard</p>
</a>
</span>
</span>
Free (free of charge)
Free for personal and commercial use.
Author: People Creations
Similar Free Stock Images

Premium


Premium


Premium


Premium


Premium


Premium


Premium


Premium


Premium


Premium


Premium


Premium


Premium


Premium


Premium


Premium


Premium


Premium


Premium


Premium


Premium


Premium


Premium


Premium


Premium