- Home >
- Stock Photos >
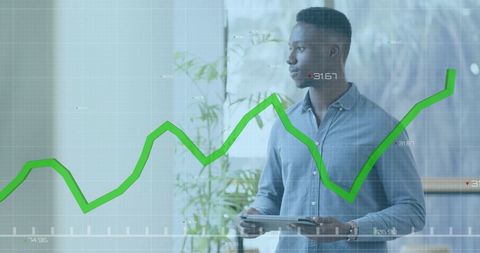
- Businessman Analyzing Global Market Data with Growth Charts
Businessman Analyzing Global Market Data with Growth Charts Image

Shows a businessman focused on analyzing financial data displayed on transparent screens. Green growth chart lines and numerical data indicate market performance. Useful for articles on financial analysis, market trends, business strategy, or technology-driven decision making.
Powered by  - Get 15% off with code: PIKWIZARD15


2
downloads
downloads
Tags:
More
Credit Photo
If you would like to credit the Photo, here are some ways you can do so
Text Link
photo Link
<span class="text-link">
<span>
<a target="_blank" href=https://pikwizard.com/photo/businessman-analyzing-global-market-data-with-growth-charts/556dc88b3fcd1885d81136954b201f3c/>PikWizard</a>
</span>
</span>
<span class="image-link">
<span
style="margin: 0 0 20px 0; display: inline-block; vertical-align: middle; width: 100%;"
>
<a
target="_blank"
href="https://pikwizard.com/photo/businessman-analyzing-global-market-data-with-growth-charts/556dc88b3fcd1885d81136954b201f3c/"
style="text-decoration: none; font-size: 10px; margin: 0;"
>
<img src="https://pikwizard.com/pw/medium/556dc88b3fcd1885d81136954b201f3c.jpg" style="margin: 0; width: 100%;" alt="" />
<p style="font-size: 12px; margin: 0;">PikWizard</p>
</a>
</span>
</span>
Free (free of charge)
Free for personal and commercial use.
Author: Awesome Content
Similar Free Stock Images

Premium


Premium


Premium


Premium


Premium


Premium


Premium


Premium


Premium


Premium


Premium


Premium


Premium


Premium


Premium


Premium


Premium


Premium


Premium


Premium


Premium


Premium


Premium


Premium


Premium