- Home >
- Stock Photos >
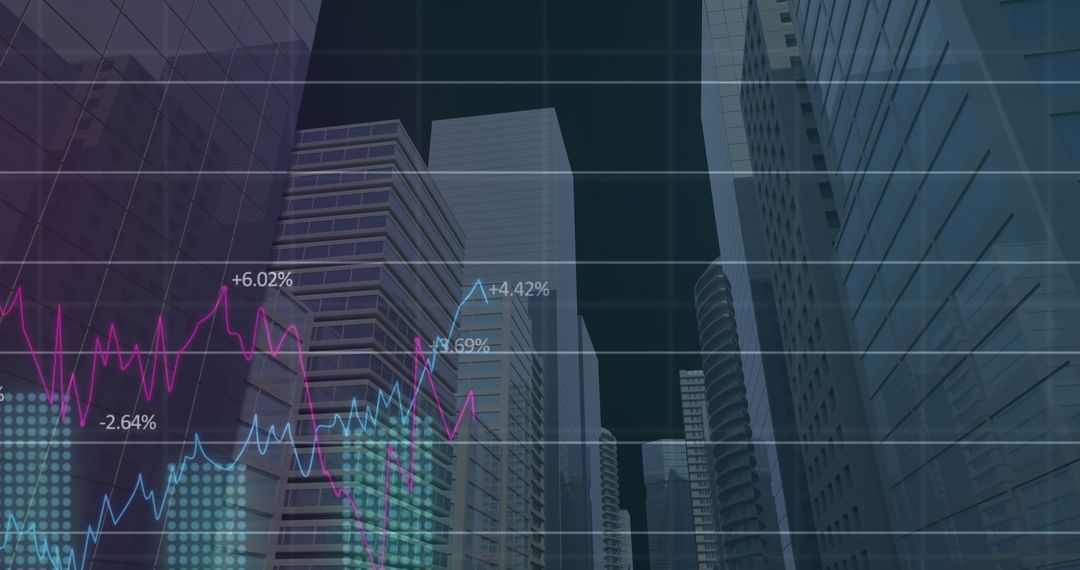
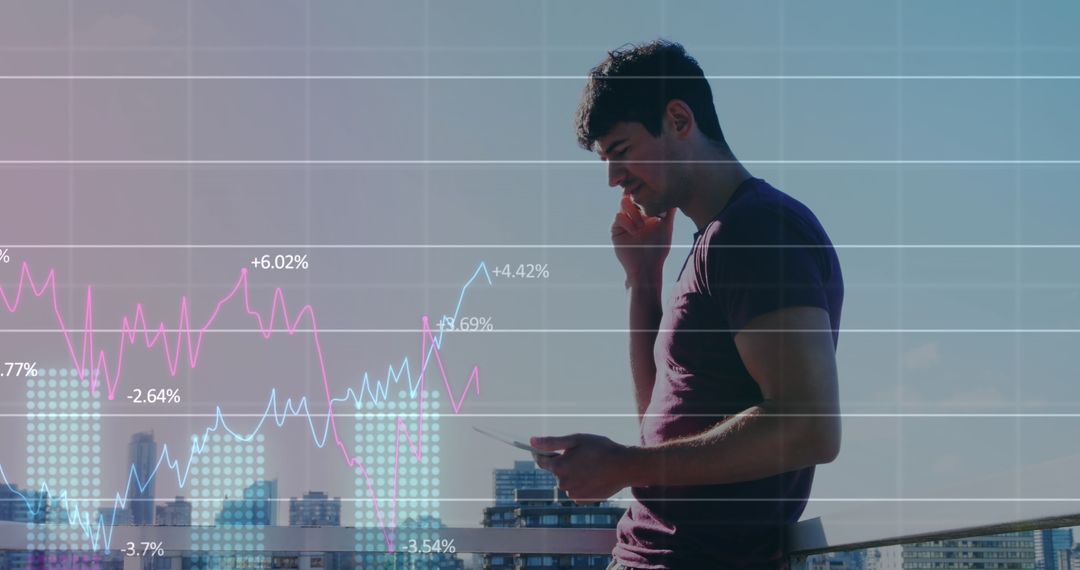
- Businessman Analyzing Graphs with Digital Data Interface in Skyline Background
Businessman Analyzing Graphs with Digital Data Interface in Skyline Background Image

Man interacting with smartphone and talking on phone while analyzing data. Symbols of positive growth reflect overlaid graphs and bars. Suitable for illustrating business strategy, digital communications, and finance-related content for presentations, blogs, or advertisements focusing on modern business approaches and technological integration.
Powered by  - Get 15% off with code: PIKWIZARD15


4
downloads
downloads
Tags:
More
Credit Photo
If you would like to credit the Photo, here are some ways you can do so
Text Link
photo Link
<span class="text-link">
<span>
<a target="_blank" href=https://pikwizard.com/photo/businessman-analyzing-graphs-with-digital-data-interface-in-skyline-background/1378b153418fc84259f0a451a5219bb9/>PikWizard</a>
</span>
</span>
<span class="image-link">
<span
style="margin: 0 0 20px 0; display: inline-block; vertical-align: middle; width: 100%;"
>
<a
target="_blank"
href="https://pikwizard.com/photo/businessman-analyzing-graphs-with-digital-data-interface-in-skyline-background/1378b153418fc84259f0a451a5219bb9/"
style="text-decoration: none; font-size: 10px; margin: 0;"
>
<img src="https://pikwizard.com/pw/medium/1378b153418fc84259f0a451a5219bb9.jpg" style="margin: 0; width: 100%;" alt="" />
<p style="font-size: 12px; margin: 0;">PikWizard</p>
</a>
</span>
</span>
Free (free of charge)
Free for personal and commercial use.
Author: Awesome Content
Similar Free Stock Images
Premium


Premium


Premium


Premium


Premium


Premium


Premium


Premium


Premium


Premium


Premium


Premium


Premium


Premium


Premium


Premium


Premium


Premium


Premium


Premium


Premium


Premium


Premium


Premium