
- Home >
- Stock Photos >
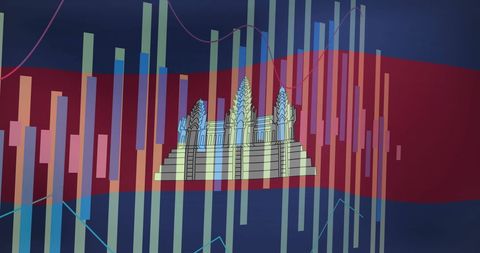
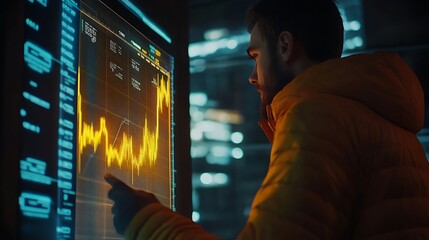
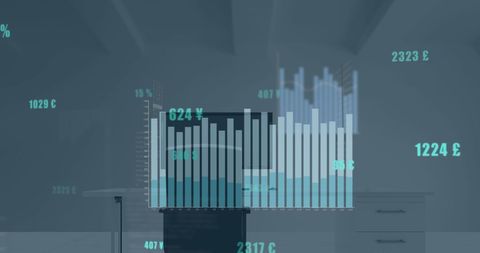
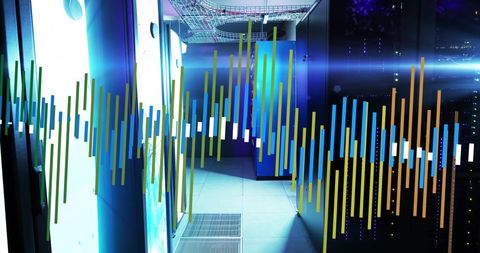
- Businessman Analyzing Holographic Data in Server Corridor
Businessman Analyzing Holographic Data in Server Corridor Image
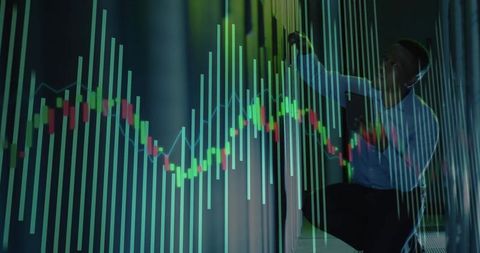
Man is engaging with holographic financial charts displayed in modern server environment, emphasizing concept of futuristic analytics in cybersecurity. Use for themes related to digital innovation, technology in business, virtual data interaction, and analytics development.
Powered by 


downloads
Tags:
More
Credit Photo
If you would like to credit the Photo, here are some ways you can do so
Text Link
photo Link
<span class="text-link">
<span>
<a target="_blank" href=https://pikwizard.com/photo/businessman-analyzing-holographic-data-in-server-corridor/ea9291eaeb36689a095d9fb5cfa3d8eb/>PikWizard</a>
</span>
</span>
<span class="image-link">
<span
style="margin: 0 0 20px 0; display: inline-block; vertical-align: middle; width: 100%;"
>
<a
target="_blank"
href="https://pikwizard.com/photo/businessman-analyzing-holographic-data-in-server-corridor/ea9291eaeb36689a095d9fb5cfa3d8eb/"
style="text-decoration: none; font-size: 10px; margin: 0;"
>
<img src="https://pikwizard.com/pw/medium/ea9291eaeb36689a095d9fb5cfa3d8eb.jpg" style="margin: 0; width: 100%;" alt="" />
<p style="font-size: 12px; margin: 0;">PikWizard</p>
</a>
</span>
</span>
Free (free of charge)
Free for personal and commercial use.
Author: People Creations
Similar Free Stock Images

Premium


Premium


Premium


Premium


Premium


Premium


Premium


Premium


Premium


Premium


Premium


Premium


Premium


Premium

Premium


Premium


Premium


Premium


Premium


Premium


Premium


Premium


Premium


Premium

Premium

Explore More Free Stock Images