- Home >
- Stock Photos >
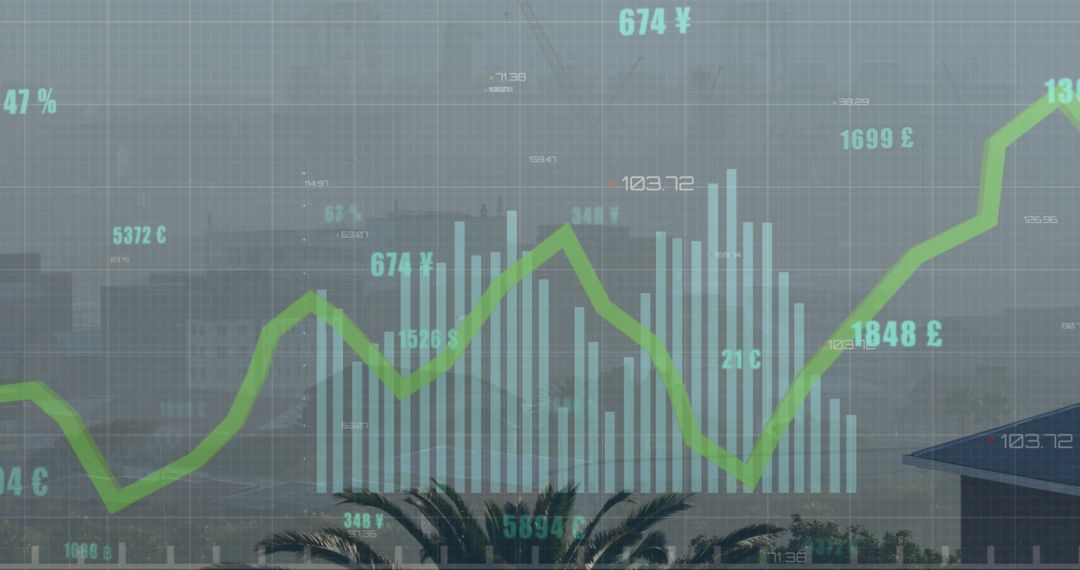
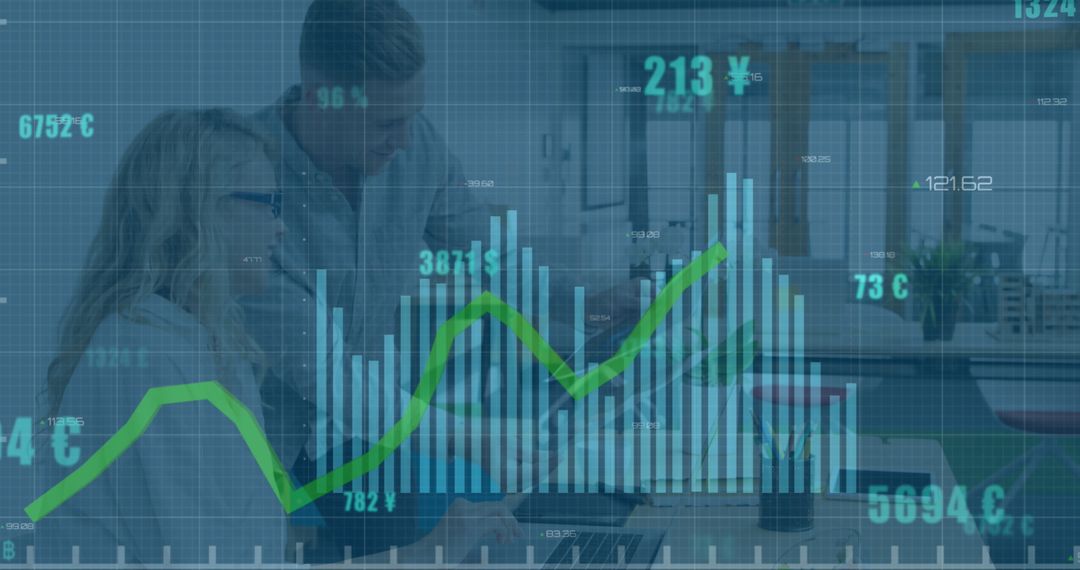
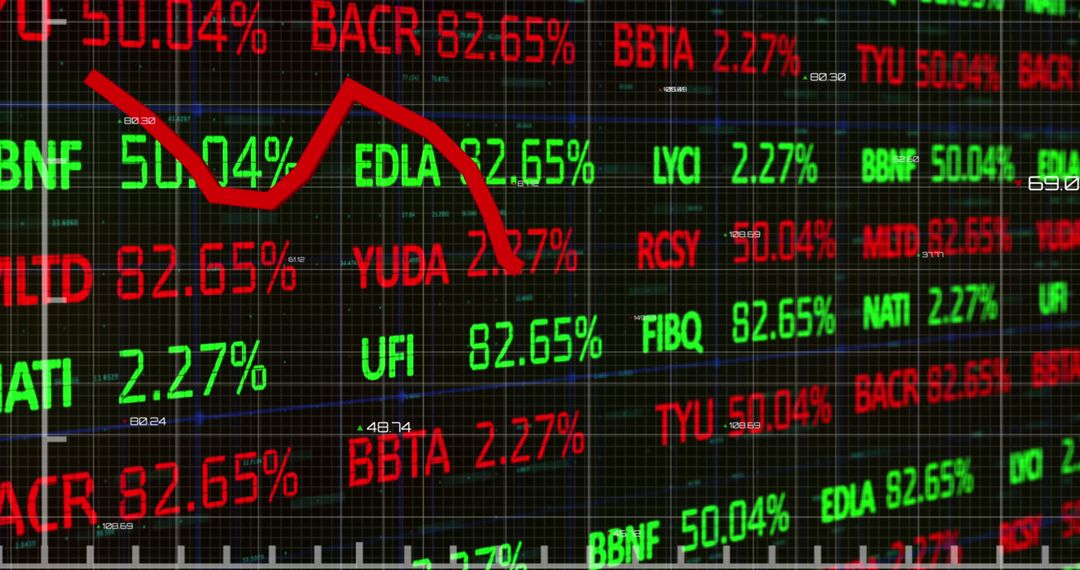
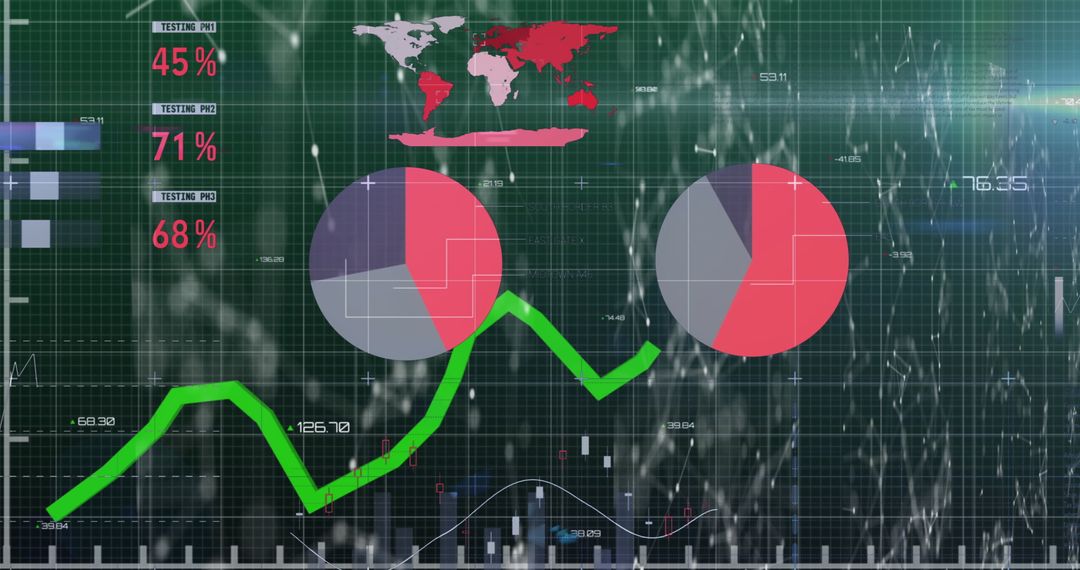
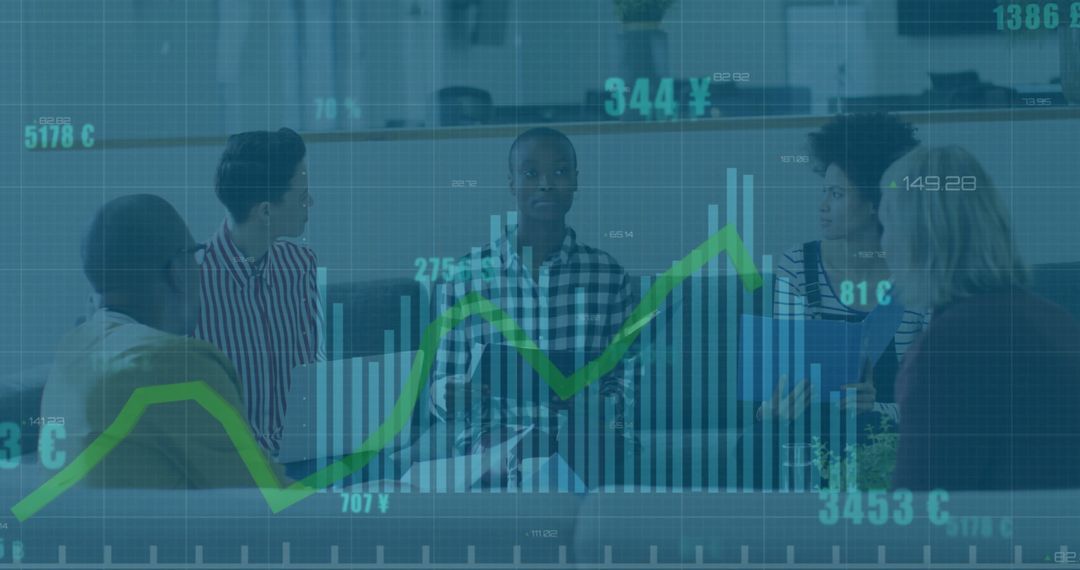
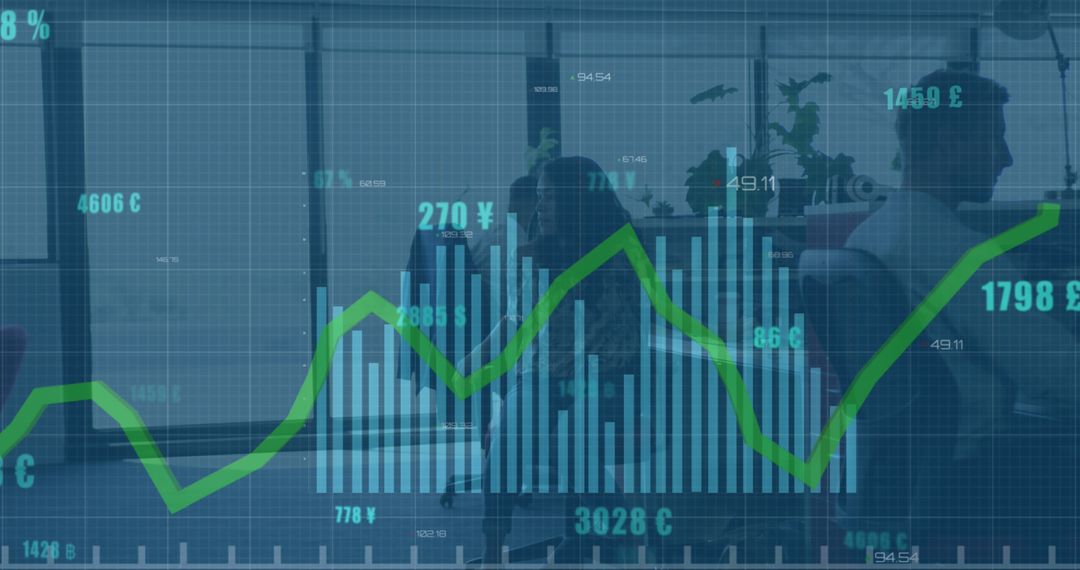
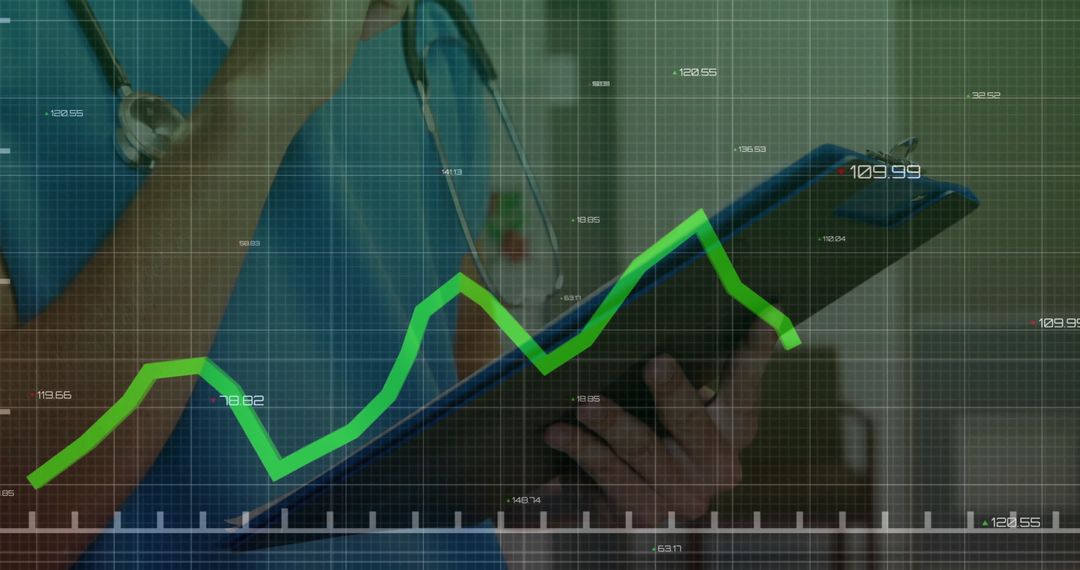
- Businessman Analyzing Trends with Futuristic Data Interface
Businessman Analyzing Trends with Futuristic Data Interface Image
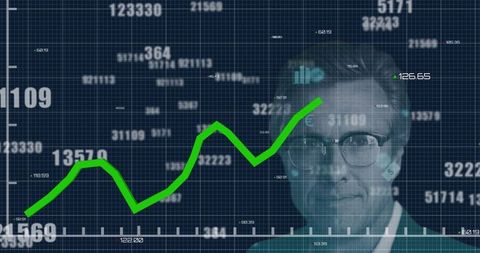
Depicts a businessman in a digital setting viewing changing numbers and a prominent green line graph, representing economic trends and financial growth. Ideal for use in articles or presentations related to business analytics, stock market analysis, modern technology, and financial consulting services. Highlights theme of economic success and technological advancement.
Powered by 


2
downloads
downloads
Tags:
More
Credit Photo
If you would like to credit the Photo, here are some ways you can do so
Text Link
photo Link
<span class="text-link">
<span>
<a target="_blank" href=https://pikwizard.com/photo/businessman-analyzing-trends-with-futuristic-data-interface/721a7444fab42d535c7ce2e50de67fb9/>PikWizard</a>
</span>
</span>
<span class="image-link">
<span
style="margin: 0 0 20px 0; display: inline-block; vertical-align: middle; width: 100%;"
>
<a
target="_blank"
href="https://pikwizard.com/photo/businessman-analyzing-trends-with-futuristic-data-interface/721a7444fab42d535c7ce2e50de67fb9/"
style="text-decoration: none; font-size: 10px; margin: 0;"
>
<img src="https://pikwizard.com/pw/medium/721a7444fab42d535c7ce2e50de67fb9.jpg" style="margin: 0; width: 100%;" alt="" />
<p style="font-size: 12px; margin: 0;">PikWizard</p>
</a>
</span>
</span>
Free (free of charge)
Free for personal and commercial use.
Author: Authentic Images
Similar Free Stock Images

Premium


Premium


Premium


Premium


Premium


Premium


Premium


Premium


Premium


Premium


Premium

Premium


Premium


Premium


Premium


Premium


Premium


Premium


Premium


Premium


Premium


Premium


Premium


Premium