1. Home > 
  2. Stock Photos > 
  3. Businessman and Cyclist Amidst Digital Data Estoatusmaps Graphs

Businessman and Cyclist Amidst Digital Data Estoatusmaps Graphs Image

Businessman and Cyclist Amidst Digital Data Estoatusmaps Graphs

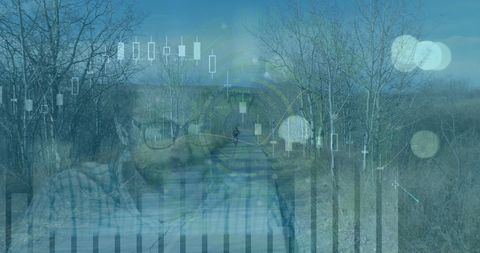
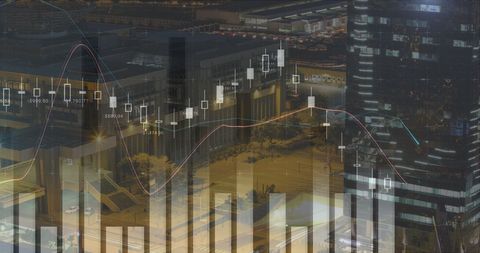
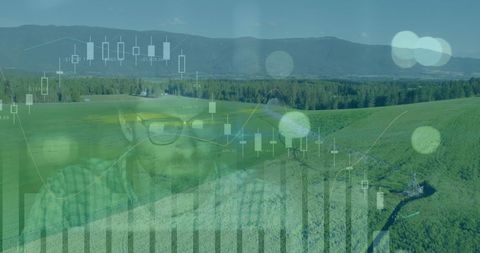
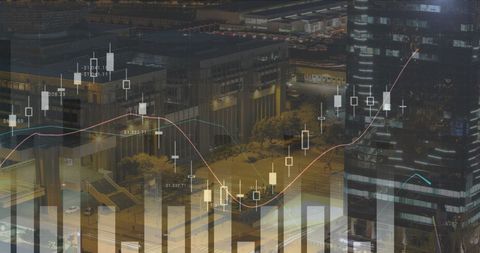
Conceptual illustration blending outdoor activity and the world of business shows a man cycling with digital data visuals overlaying. This symbolizes the intersection of nature, physical activity, and digital innovation, great for representing harmony between technology and lifestyle or illustrating analysis and exploration themes.

Powered by Adobe logo
Businessman s hands protect four wooden cubes representing business growth technology and cloud computing concepts on a desk - Powered by AdobeBusinessman in formal suit demonstrating product development and sprint cycle process. - Powered by AdobeHands typing on a laptop with a digital workflow diagram overlaying the screen - Powered by AdobeDevOps software development concept. IT operations, high software quality and software development. Agile programming development. Businessman use laptop with DevOps icon on virtual screen. - Powered by AdobeBusinessman Holding Circular Refresh Icon Concept for Update, Sync, and Continuous Process - Powered by Adobe

Credit Photo

If you would like to credit the Photo, here are some ways you can do so

Free (free of charge)

Free for personal and commercial use.

Author: Creative Art

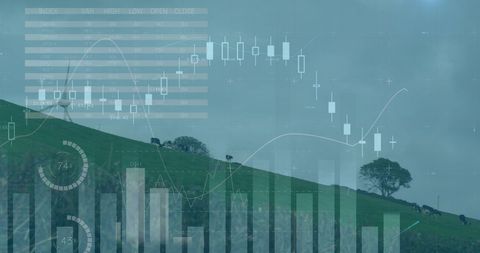
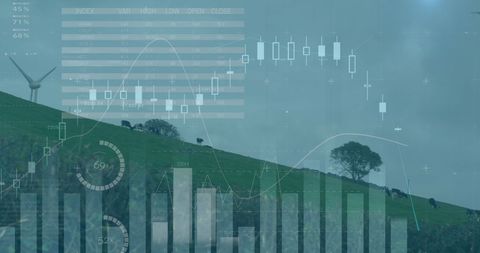
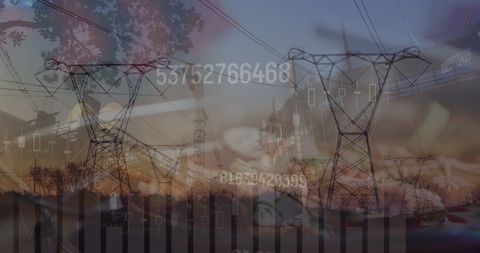
Similar Free Stock Images

Wind Turbines and Stock Graphs Illustrating Global Economics
Premium
Businessman holding a glowing digital refresh symbol, representing data synchronization and continuous process improvement.
Financial Data and Construction in Bustling Cityscape
Innovative Construction and Data Integration
Futuristic Data Processing Over Cityscape Visualizing Digital Concepts
Digital Data Processing Over Cityscape with Business Charts
Premium
Businessman's hand interacts with glowing financial cycle graphic, symbolizing growth and success
Digital Interface Overlapping Windmill Enhancing Global Connection Concepts
Construction Site with Overlayed Financial Charts and Data
Data Processing Overlay on Urban Skyline
Wind Turbines Overlayed with Dynamic Financial Charts
Premium
Businessman Holding Smartphone with Agile Development Icons on Screen. Software Development Concept
Caucasian Businesswoman Analyzing Financial Data Background
Businessman Analyzing Financial Growth with Digital Technology
Innovative Business Team Analyzing Financial Data Overlay
Data Processing Analytics Overlay on Businessman
Premium
An abstract background with beautiful abstract business transformation innovation. Change from traditional to high technology-like life cycle of a butterfly. To imply a successful future business
Financial Data and Cityscape Overlap Symbolizing Global Economy
Digital Overlay on Power Pylons Representing Energy Data
Digital Financial Data and Diverse Warehouse Workers Blend
Financial Charts Overlaying Construction and Warehouse Scenes
Premium
A businessman in a suit holds out his hand, displaying a glowing hologram of time management and productivity icons, symbolizing efficient project planning and workflow optimization in a modern office
Graphs and Charts Overlay on Urban Traffic Timelapse
Finance and Renewable Energy Collage with Wind Turbine
Futuristic Renewable Energy and Data Analysis Concept
Modern Cityscape with Financial Data Overlay and Graphs
Premium
A businessman analyzes tax refund information on a tablet against an urban backdrop, showcasing the intersection of finance and technology during tax season. Gantry
Digital Trade Overlay Shows Data Networkscape
Analyzing Data in Renewable Energy Context with Wind Turbine and Charts
Construction Site with Financial Data Overlay
Data-Driven Farming Analytics Overlay Blend with Serene Countryside
Stocks Exposed Over Bustling Highway and Energy Structures
Futuristic Financial Trading Graphs in Night Cityscape
Premium
Futuristic concept of Life Cycle Assessment (LCA) displayed as holographic interface in businessman's hand on dark background with digital elements.
Cityscape with Digital Data Overlay Representing Global Connections
Sustainable Energy Future with Digital Data Overlay
Abstract Data Processing Over Cityscape for Global Connections Concept
Financial Data Analysis with Overlays and Business People
Premium
Innovative idea cycle visualized with gear and lightbulb activating business growth strategies
Financial Data and Renewable Energy on Construction Site
Wind Turbines and Stock Market Trends in Agriculture
Digital Data Overlay on Cityscape Concept
Digital Financial Chart Overlay on Night Cityscape
Premium
Cyclist making phone call, standing on streeet.
Futuristic Traffic Technology and Data over Urban Cityscape
Financial Data Processing with Urban Business Activity
Cyclist Fused with Financial Data Overlay Concept
Technology Meets Nature: Fusion of Data and Agricultural Landscapes
Premium
Businessman touching a glowing infinity symbol with arrows, representing the concept of circular economy and sustainability in business
Innovative Construction with Technology Overlay
Dynamic Mixed Graphs Above an Illuminated City Nightscape
Financial Graphs Overlayed on Countryside Landscape
Futuristic Urban Skyline with Financial Growth Analytics
Premium
Enterprise resource planning concept. Businessman using tablet and laptop for business management planning and company improvement. Technology, Network, Enterprise resource planning.
Digital Interface Overlay on Cityscape Highlights Modern Data Exchange
Financial Data Overlay with Global Networking Concepts
Businesswoman Analyzing Tech Data with Smartphone
Construction Site with Stock Market Overlay Illustrating Economic Growth
Premium
Businessman uses a futuristic interface to show a business management cycle.
Futuristic Data Visualization of Energy on Vibrant Highway Landscape
Innovative Data Integration in Sustainable Farming Tech
Futuristic Agriculture Data Visualization in Rural Field
Financial Graphs Overlaid on Scenic Highway at Dusk
Bats Flying Over Moonlit Night Sky for Halloween
Investment Dynamics: Construction Meets Financial Data Analysis
Premium
A futuristic startup leader controlling global business analytics from a floating digital screen
Cityscape Digital Data Interface with Business Analytics
Digital World Integration with Urban Landscape
Businessman Analyzing Financial Data with Graphical Overlay
Digital Interface Overlay on Green Landscape
Premium
Man working with automation diagram, process optimization for greater efficiency, new project development strategy
Increasing Stock Graph and Wind Turbines in Countryside
Man Analyzing Data on Laptop with Graphs Overlapping
Digital Globe with Global Business Data Over Cityscape
Financial Analytics Overlay on Urban Construction Site
Premium
Businessman hold DevOps words and growth technology and data connection. Continuous integration, software deployment, agile development, system automation.
Business Professionals Reviewing Documents with Data Overlay
Data Overlay on Construction Site Symbolizing Global Business Processing
Data Overlay on Scenic Field with Businessman
Cityscape Blend with Financial Data Overlay Displaying Analysis
Premium
Businessperson discussing data and insurance sales in city.
Digital Financial Data Overlays Modern Cityscape
Global Business Innovation in Aviation Technology Scene
Complex Statistical Analysis with Mathematical Formulas on Green Background
Dynamic Financial Data and Urban Traffic Time-lapse Composite
Premium
Businessman enjoying coffee and smartphone on city bike commute
Global Financial Data Analytics in Cityscape
Digital Data Overlay with City Construction Site
Global Finance and Investment Analysis with Digital Interface
Financial Data Analysis with Night City Background
Premium
Sales performance analysis with digital graph showing optimization and improved efficiency
Tower Crane Construction with Financial Data Integration Overlay
Focused Analyst Integrating Technology and Data in Modern Business Environment
Financial Data Overlay with Night City Traffic
Financial Data Overlaid on Construction Site
Digital Media Integration Urban Landscape and Nature
Digital Data Analysis Over Renewable Energy Windmill Scene
Premium
Sales performance analysis with digital graph showing optimization and improved efficiency
Dynamics of Finance with Timelapse City Traffic
Renewable Energy Data Analysis With Wind Turbine Background
Renewable Energy Concept with Overlay of Data Analytics and Wind Turbines
Digital Data Analysis Overlap with Renewable Energy Landscape
Premium
Businessman holding a glowing digital financial cycle with bank building and currency symbols in a dark background
Financial Data Overlay on Business Figures in Motion
Businessman Analyzing Digital Data with Financial Graphs
Business Professional Analyzing Financial Data
Financial Analysis Meeting with Digital Interface and Market Data
Premium
A businessman displays a digital infinity symbol representing endless growth potential and continuous improvement in business strategy.
Business Data Overlay on Tranquil Forest Landscape
Dynamic Cityscape with Financial Graphs Overlay at Night
Digital Composite of Urban Business and Technology Themes
Contemplative Businesswoman Analyzing Digital Financial Data Late at Office
Premium
Person interacting with digital agile methodology flowchart on laptop screen hand technology
Global Economic Trends with Graphs and Charts Overlay
Abstract Finance Data and Renewable Energy Integration
Double Exposure of Financial Graphs Over Utility Pole at Sunset
Cityscape Embedded with Digital Data Interface Highlights
Premium
Businessman selecting holographic customer journey cycle with icons for evaluation satisfaction repeat business and revenue growth strategy
Financial Graphs Overlaid on Modern Cityscape for Business Analysis
Mathematical Formula Overlay on High Voltage Power Lines Landscape
Abstract Analysis of Global Business with Digital Interface
Businesswoman Analyzing Bar Chart with Code Overlay in Office
Premium
Man viewing a diagram of Agile and Dev Ops IT project management with cloud computing businessman suit
Analyzing Collaborative Team Reviewing Augmented Reality Data Dashboards and Graphs