- Home >
- Stock Photos >
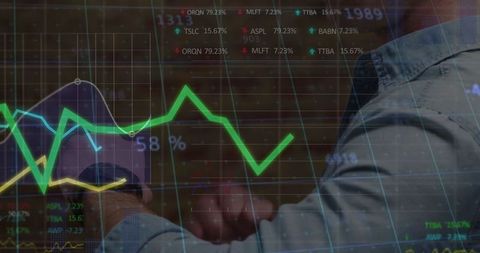
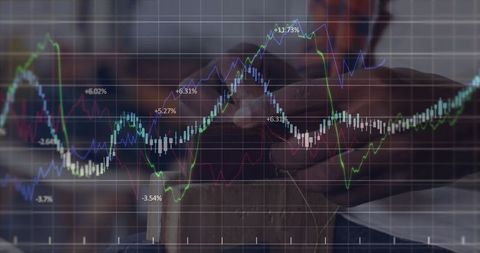
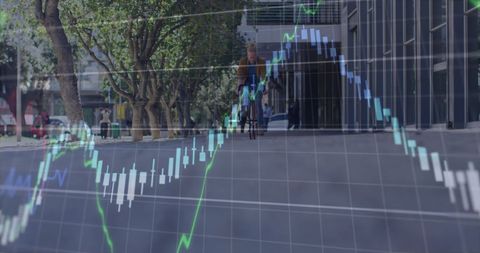
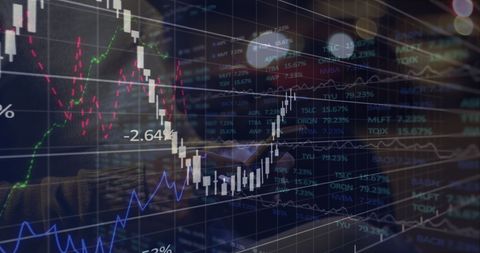
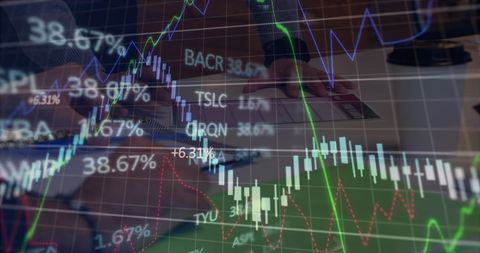
- Businessman Engaged with Financial Market Data and Graphs
Businessman Engaged with Financial Market Data and Graphs Image
Businessman interacting with smartphone while financial data, including graphs and stock trends, overlays him. Ideal for illustrating global business concepts, financial technology or analytics. Perfect for articles about digital trading, market strategies, fintech innovations, or global economic analysis.
Powered by  - Get 15% off with code: PIKWIZARD15


downloads
Tags:
More
Credit Photo
If you would like to credit the Photo, here are some ways you can do so
Text Link
photo Link
<span class="text-link">
<span>
<a target="_blank" href=https://pikwizard.com/photo/businessman-engaged-with-financial-market-data-and-graphs/351375a8206ac7a26dcedd4b0ead7cc6/>PikWizard</a>
</span>
</span>
<span class="image-link">
<span
style="margin: 0 0 20px 0; display: inline-block; vertical-align: middle; width: 100%;"
>
<a
target="_blank"
href="https://pikwizard.com/photo/businessman-engaged-with-financial-market-data-and-graphs/351375a8206ac7a26dcedd4b0ead7cc6/"
style="text-decoration: none; font-size: 10px; margin: 0;"
>
<img src="https://pikwizard.com/pw/medium/351375a8206ac7a26dcedd4b0ead7cc6.jpg" style="margin: 0; width: 100%;" alt="" />
<p style="font-size: 12px; margin: 0;">PikWizard</p>
</a>
</span>
</span>
Free (free of charge)
Free for personal and commercial use.
Author: Creative Art
Similar Free Stock Images
Loading...

Premium


Premium

Premium


Premium


Premium


Premium

Premium

Premium


Premium

Premium


Premium

Premium

Premium


Premium

Premium

Premium


Premium


Premium


Premium


Premium


Premium

Premium

Premium


Premium


Premium