- Home >
- Stock Photos >
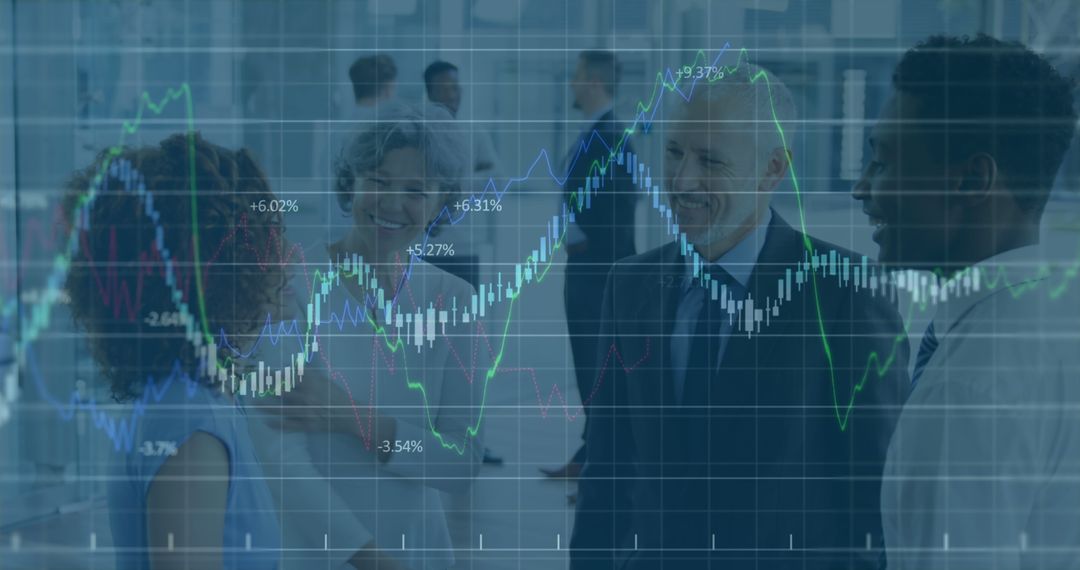
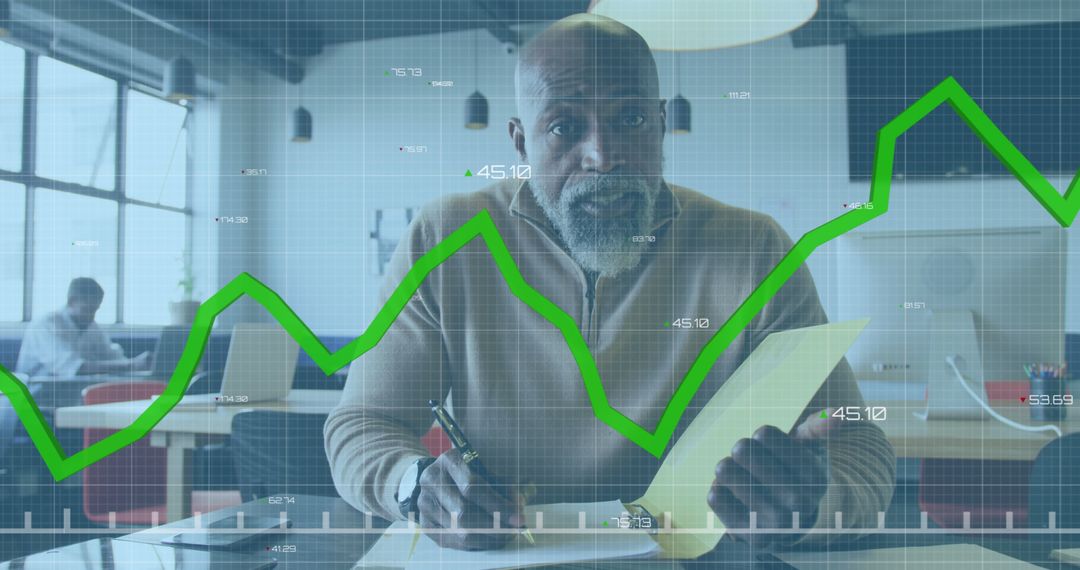
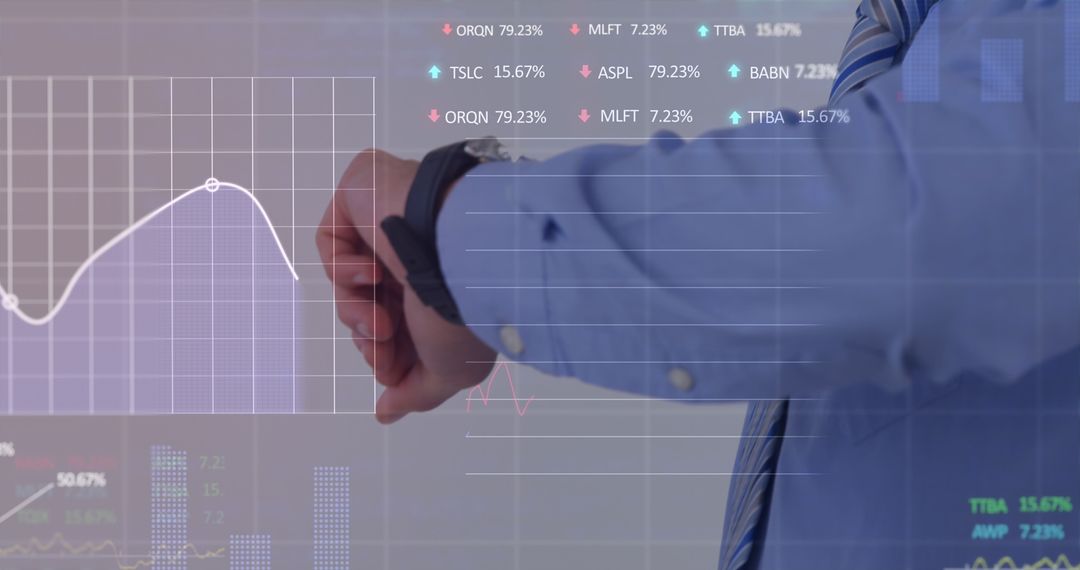
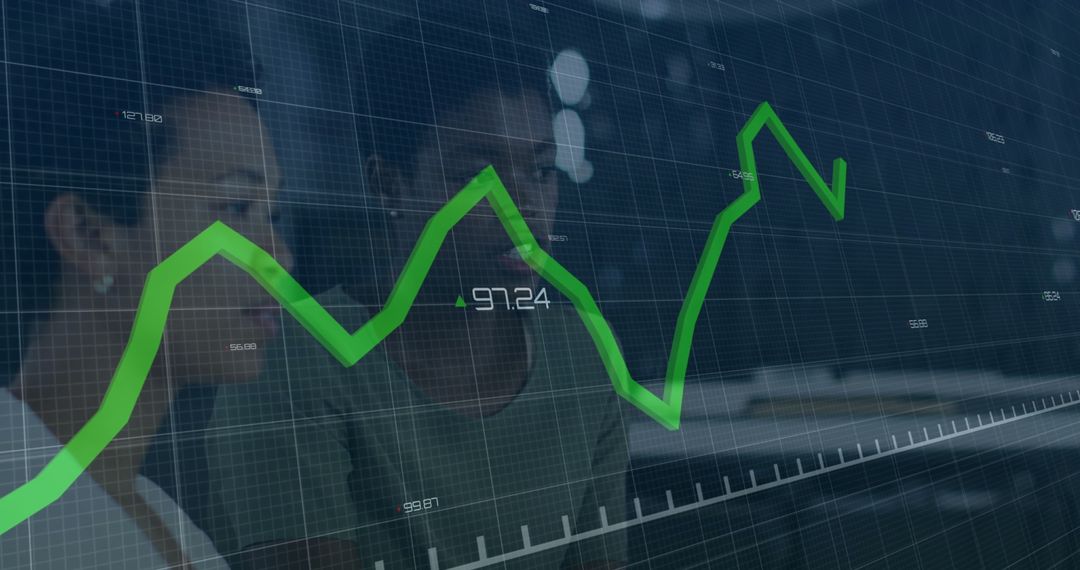
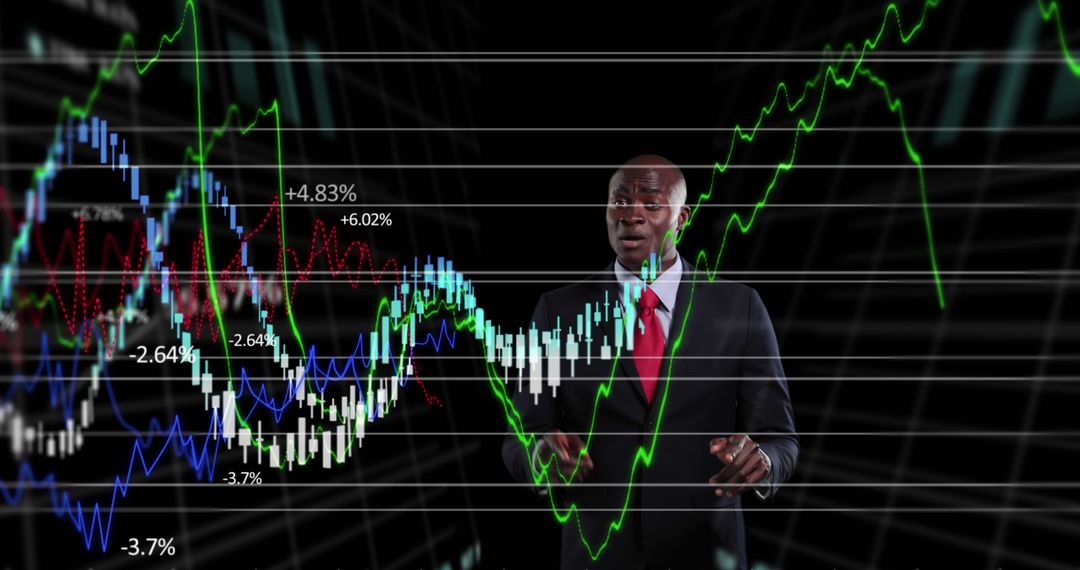
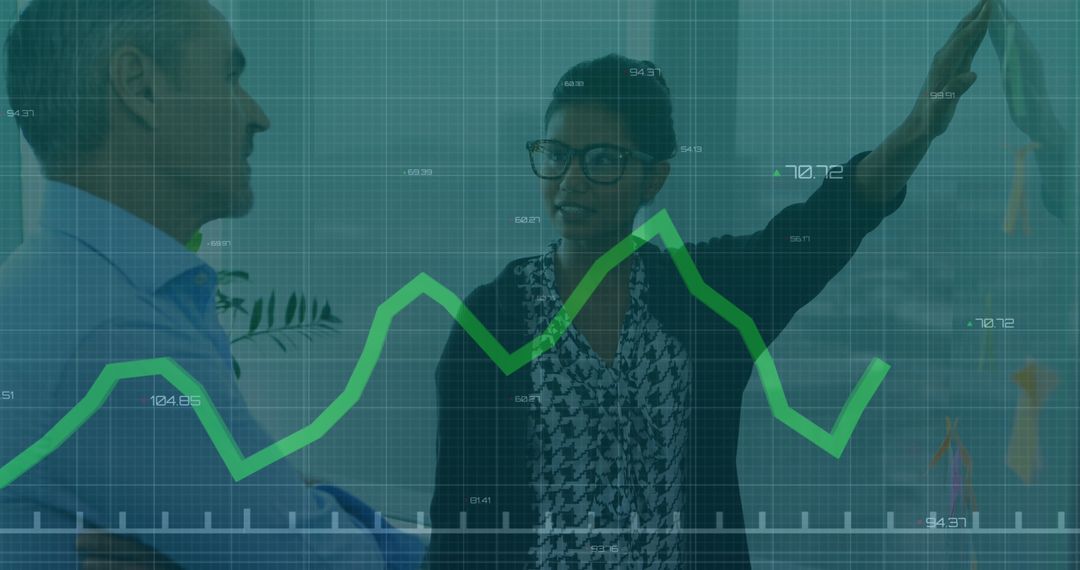
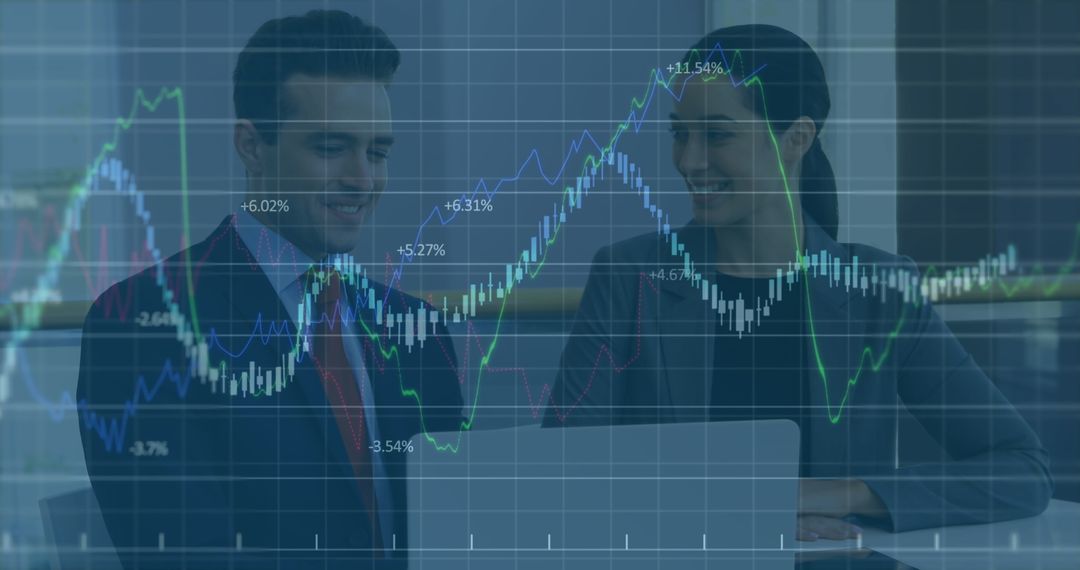
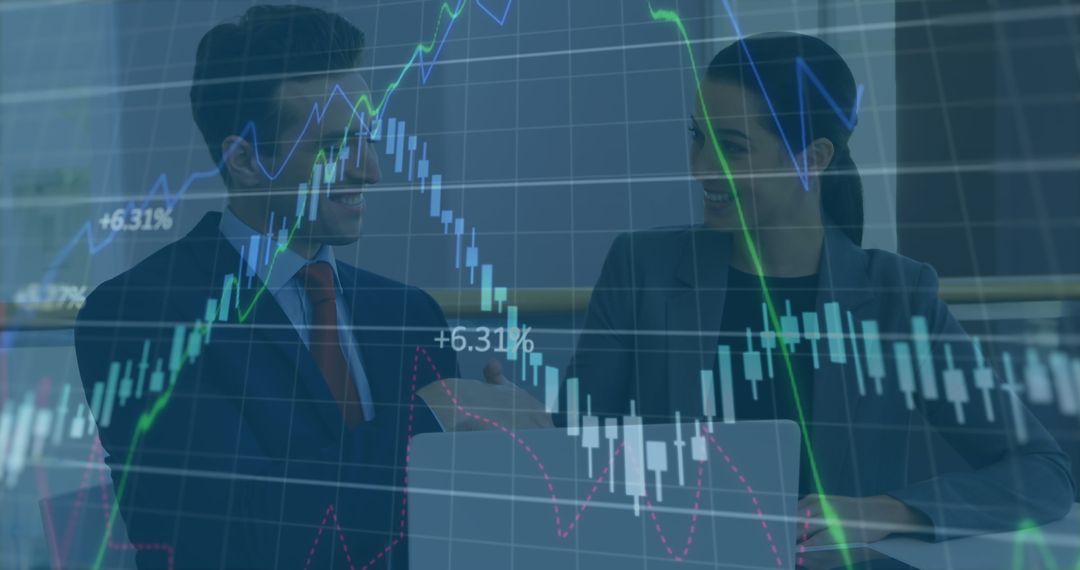
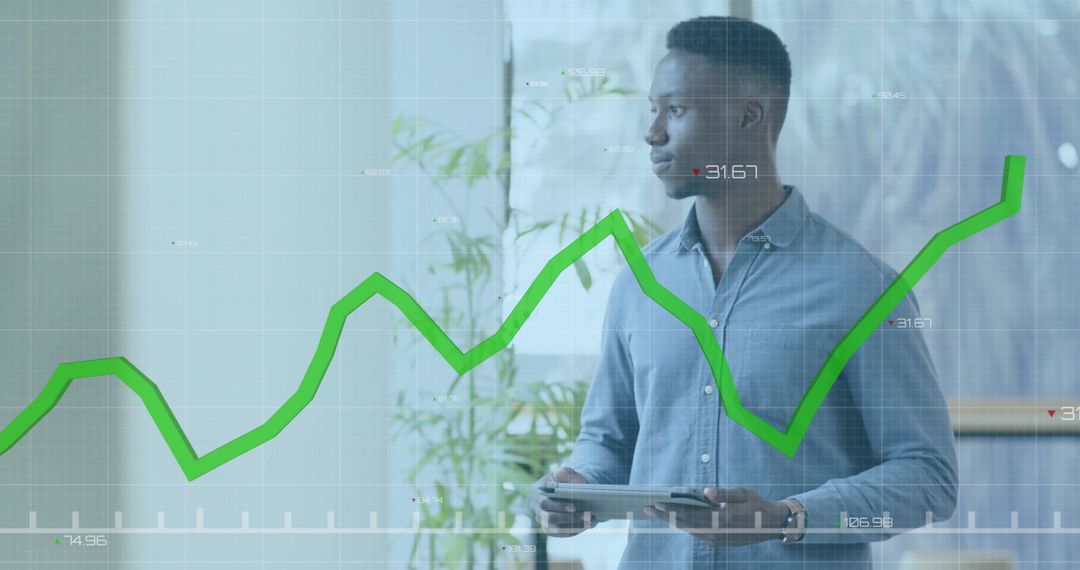
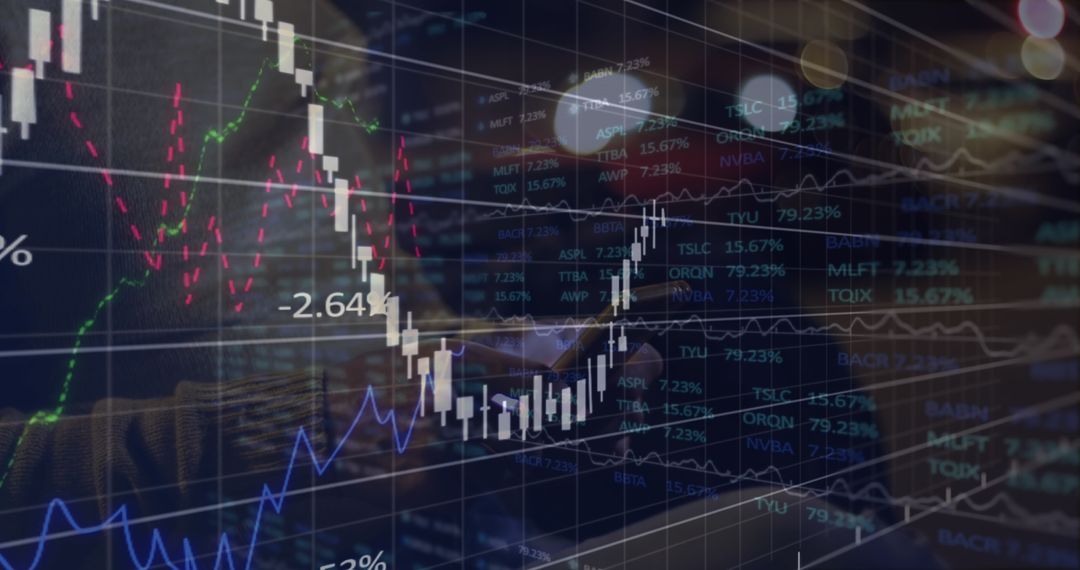
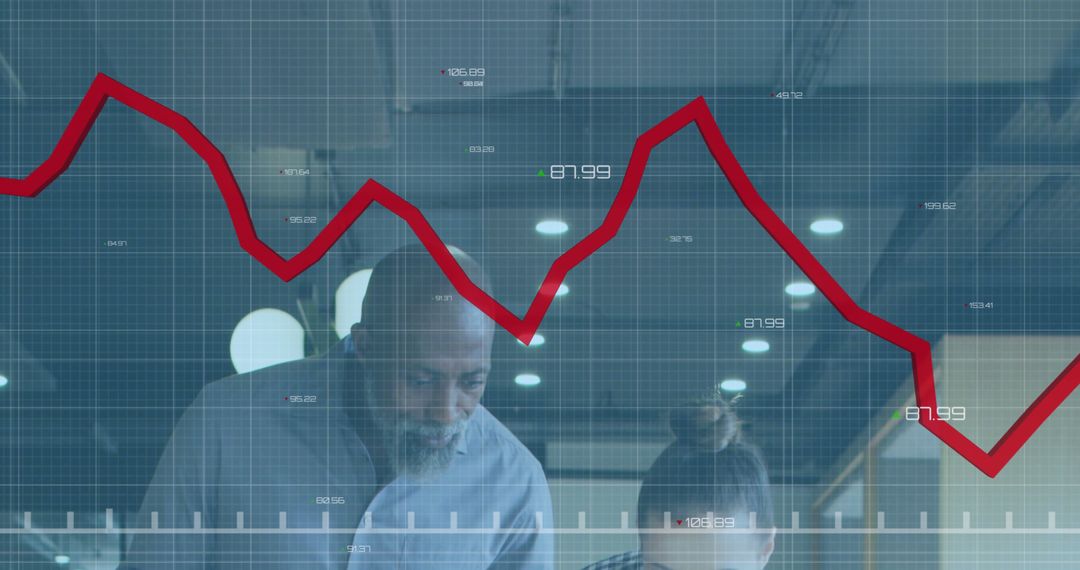
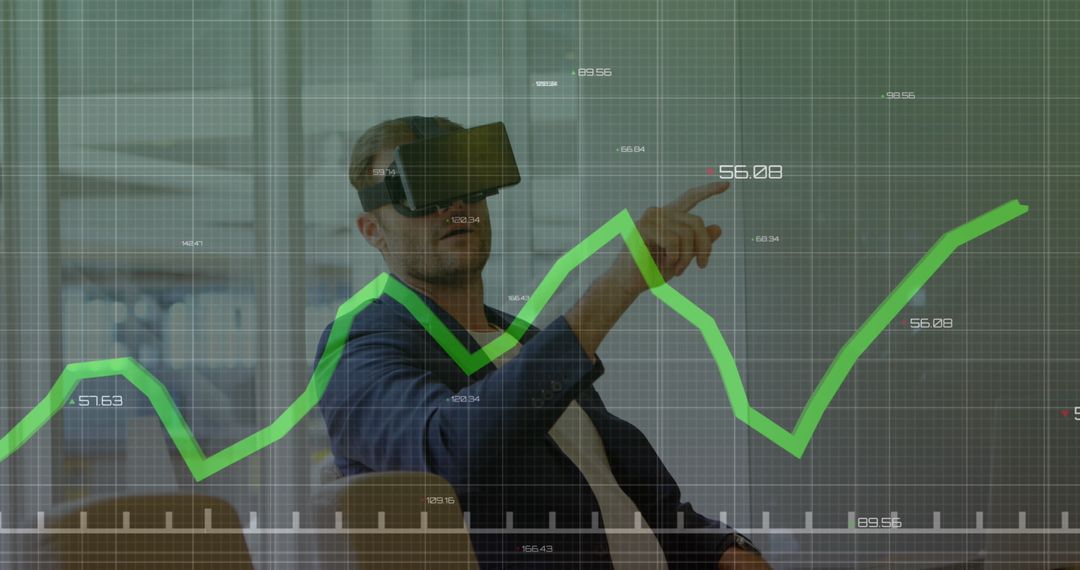
- Businessman Interacting with Virtual Financial Graphs Display
Businessman Interacting with Virtual Financial Graphs Display Image
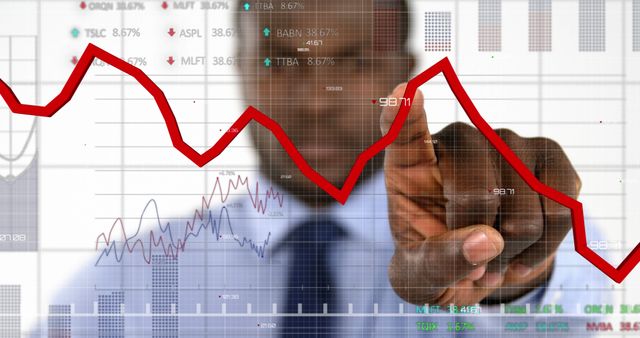
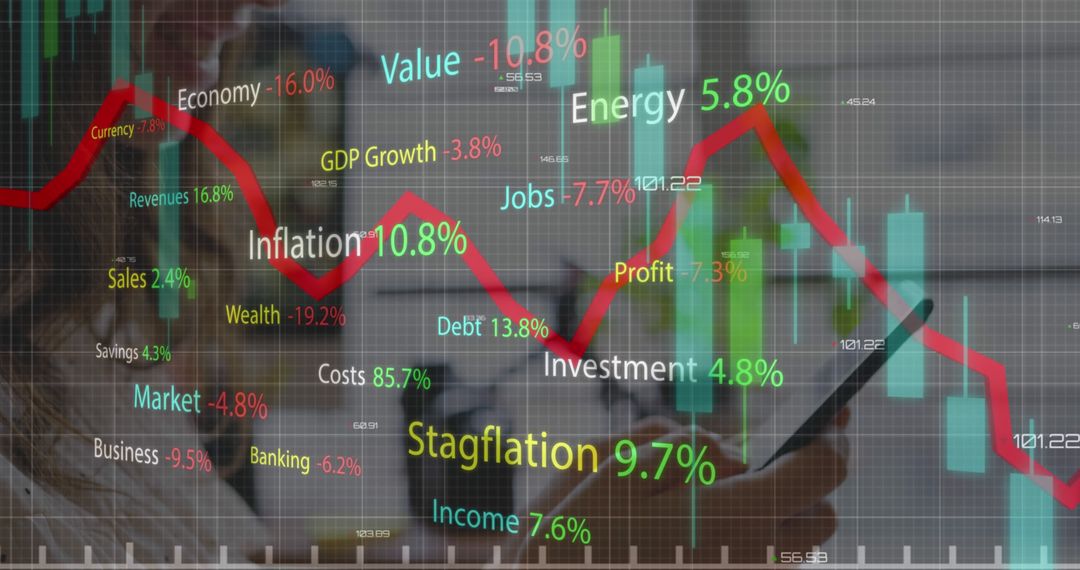
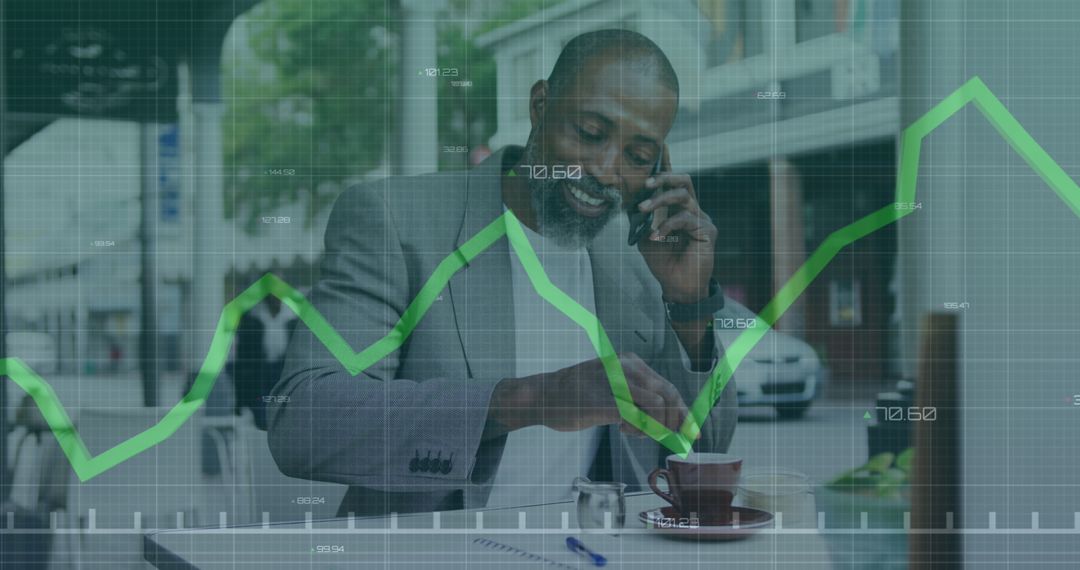
An African American businessman is engaging with virtual financial graphs indicative of stock market trends and data analysis. This visual embodies the concept of modern businesses utilizing technology and digital tools in the analysis and prediction of economic developments. Ideal for materials related to financial analysis, economic forecasting, and the integration of technology in business processes.
Powered by  - Get 15% off with code: PIKWIZARD15


2
downloads
downloads
Tags:
More
Credit Photo
If you would like to credit the Photo, here are some ways you can do so
Text Link
photo Link
<span class="text-link">
<span>
<a target="_blank" href=https://pikwizard.com/photo/businessman-interacting-with-virtual-financial-graphs-display/9af06676a2be72c30ffdc7b5922619d3/>PikWizard</a>
</span>
</span>
<span class="image-link">
<span
style="margin: 0 0 20px 0; display: inline-block; vertical-align: middle; width: 100%;"
>
<a
target="_blank"
href="https://pikwizard.com/photo/businessman-interacting-with-virtual-financial-graphs-display/9af06676a2be72c30ffdc7b5922619d3/"
style="text-decoration: none; font-size: 10px; margin: 0;"
>
<img src="https://pikwizard.com/pw/medium/9af06676a2be72c30ffdc7b5922619d3.jpg" style="margin: 0; width: 100%;" alt="" />
<p style="font-size: 12px; margin: 0;">PikWizard</p>
</a>
</span>
</span>
Free (free of charge)
Free for personal and commercial use.
Author: Awesome Content
Similar Free Stock Images

Premium


Premium


Premium


Premium


Premium


Premium


Premium


Premium


Premium


Premium


Premium


Premium


Premium


Premium


Premium


Premium


Premium


Premium


Premium

Premium


Premium


Premium


Premium


Premium