- Home >
- Stock Photos >
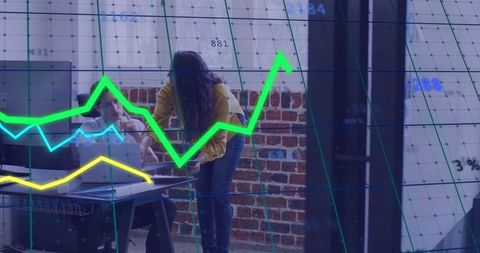
- Businesswoman Analyzing Financial Charts on Tablet with Overlaid Data Visualizations
Businesswoman Analyzing Financial Charts on Tablet with Overlaid Data Visualizations Image

Showing central businesswoman holding tablet, layered line and bar charts overlaying to highlight market trends, performance metrics, and data-driven decision making. Blue-tinted color palette creating modern high-tech corporate atmosphere. Blurred teammates in background suggesting collaboration and professional teamwork. Suggested uses - Website hero banner for fintech, investment, or analytics companies - Presentation slides and annual reports illustrating market growth, forecasting, or KPI dashboards - Blog headers, social media posts, and marketing materials promoting financial services, data analytics, or digital transformation - Training materials and e-learning modules about data literacy, trading, or business intelligence Editing suggestions - Crop to tighter tablet close-up to emphasize hands and on-screen charts - Increase contrast or adjust chart colors to match brand palette - Add headline text or logo in right-side empty space for marketing banners - Apply subtle overlay gradient or blur to improve typography legibility
Powered by  - Get 15% off with code: PIKWIZARD15


0
downloads
downloads
Tags:
More
Credit Photo
If you would like to credit the Photo, here are some ways you can do so
Text Link
photo Link
<span class="text-link">
<span>
<a target="_blank" href=https://pikwizard.com/photo/businesswoman-analyzing-financial-charts-on-tablet-with-overlaid-data-visualizations/01cd98b791dc078c4193934499d66c1b/>PikWizard</a>
</span>
</span>
<span class="image-link">
<span
style="margin: 0 0 20px 0; display: inline-block; vertical-align: middle; width: 100%;"
>
<a
target="_blank"
href="https://pikwizard.com/photo/businesswoman-analyzing-financial-charts-on-tablet-with-overlaid-data-visualizations/01cd98b791dc078c4193934499d66c1b/"
style="text-decoration: none; font-size: 10px; margin: 0;"
>
<img src="https://pikwizard.com/pw/medium/01cd98b791dc078c4193934499d66c1b.jpg" style="margin: 0; width: 100%;" alt="" />
<p style="font-size: 12px; margin: 0;">PikWizard</p>
</a>
</span>
</span>
Free (free of charge)
Free for personal and commercial use.
Author: Creative Art
Similar Free Stock Images

Premium


Premium


Premium


Premium


Premium


Premium


Premium


Premium


Premium


Premium


Premium


Premium


Premium


Premium


Premium


Premium


Premium


Premium


Premium


Premium


Premium


Premium


Premium


Premium


Premium