- Home >
- Stock Photos >
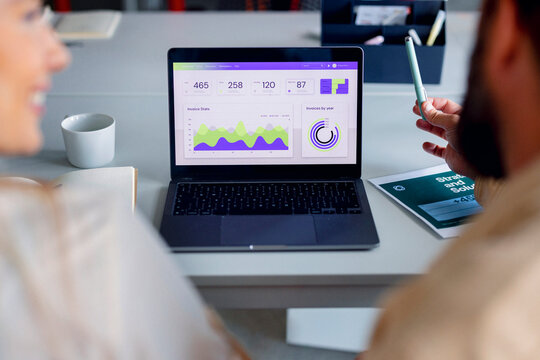
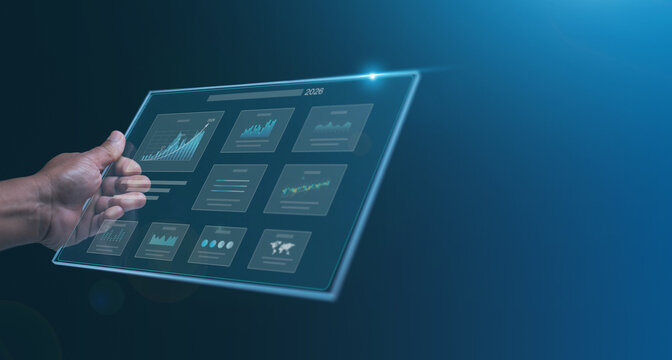
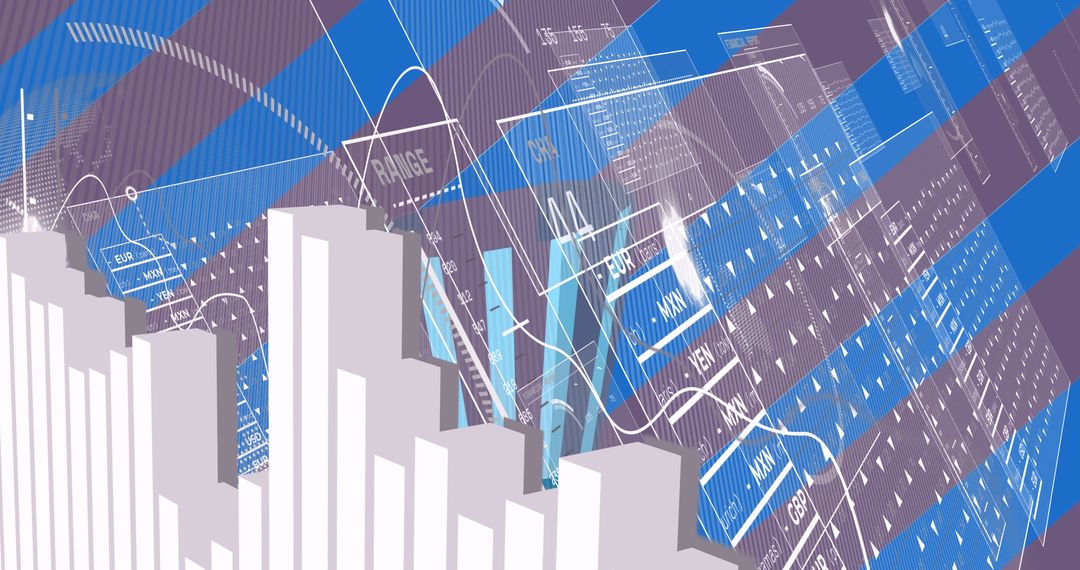
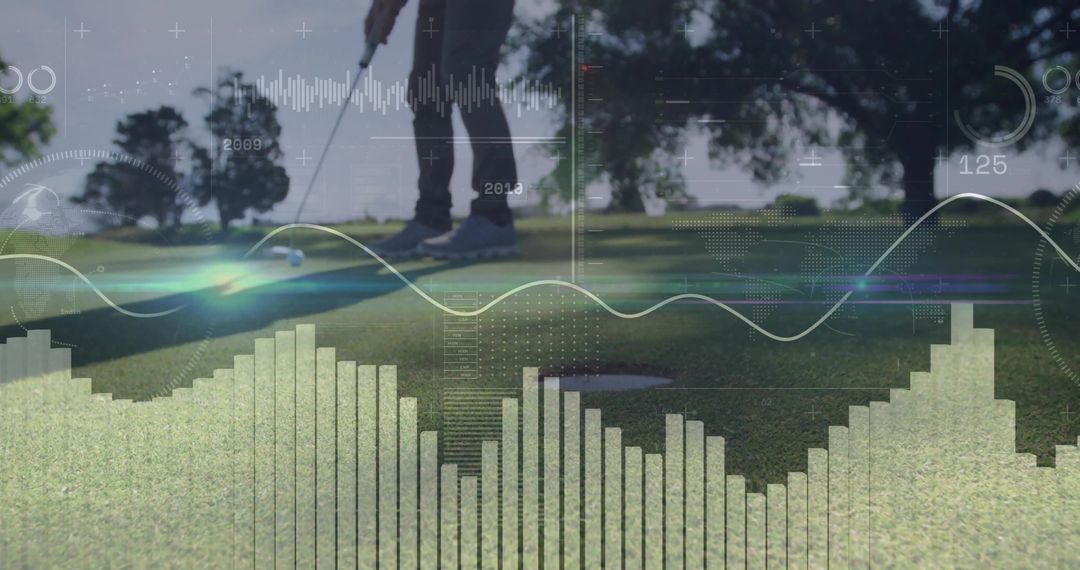
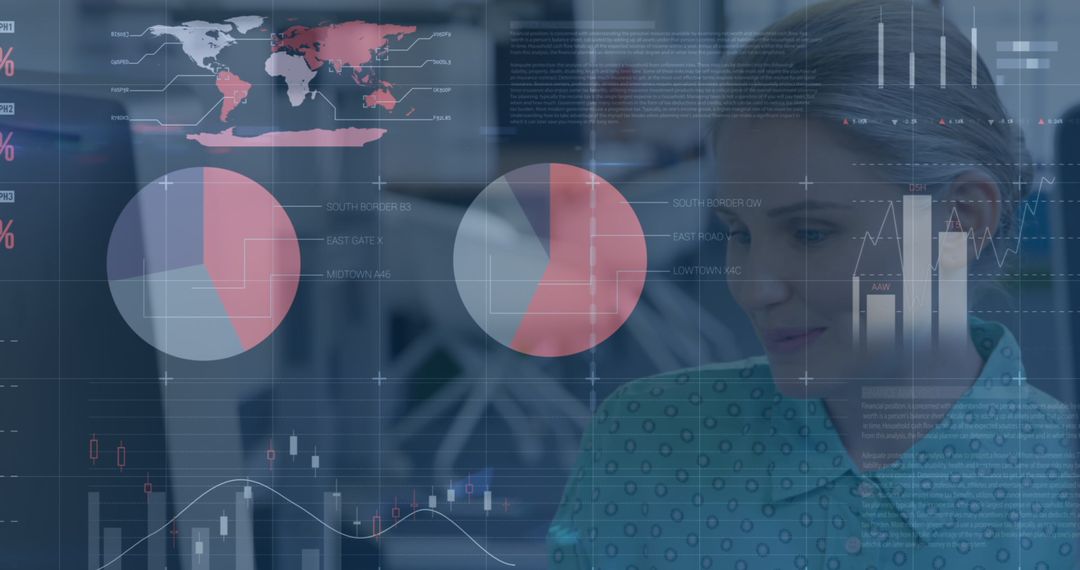
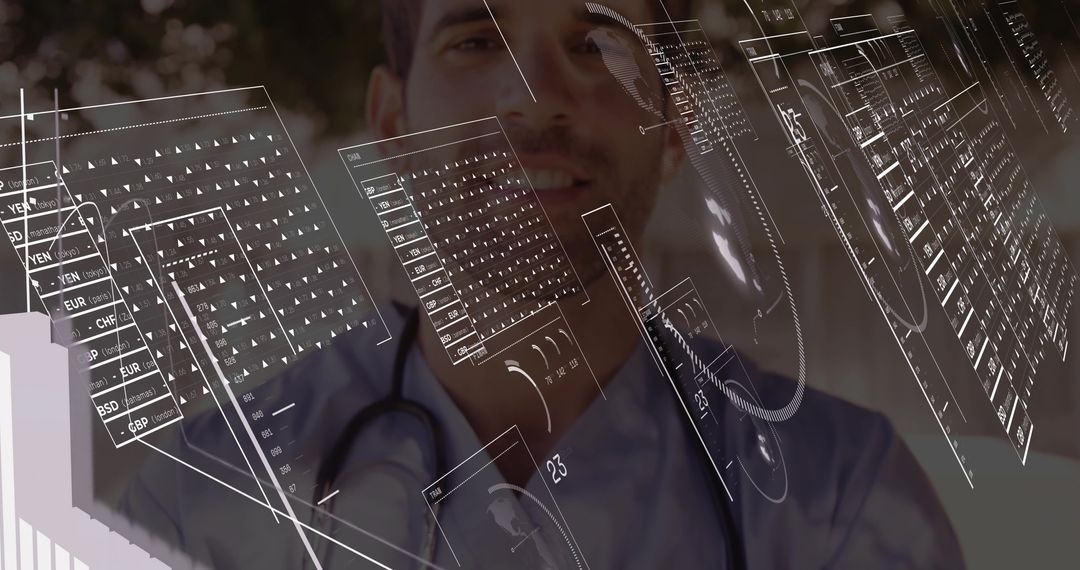
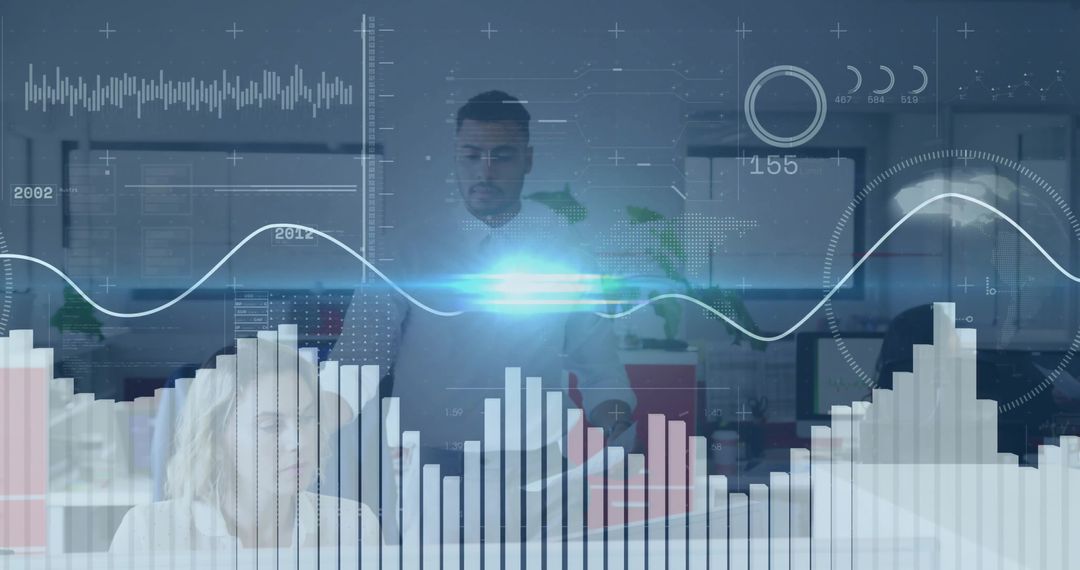
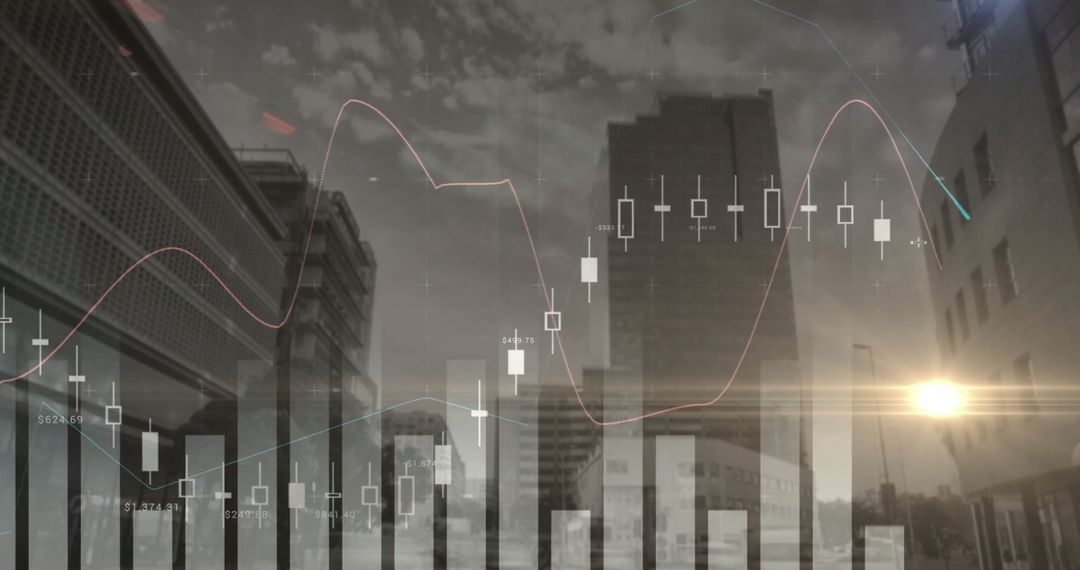
- Businesswoman Analyzing Financial Charts with Floating 3D Graphs, Data Panels and Laptop
Businesswoman Analyzing Financial Charts with Floating 3D Graphs, Data Panels and Laptop Image

Scene showing professional woman analyzing financial charts on laptop with translucent floating data panels, 3D bar graphs and line charts overlaying office workspace. Composition creating strong visual for finance, fintech, investment, trading and business analytics narratives. Working well for website headers, hero banners, corporate presentations, annual reports, market research slides, fintech app promos, social media ads, blog posts and editorial layouts. Providing copy space on right for headlines, logos and data callouts while allowing layered text and infographics. Color palette featuring cool blues, neutral grays and white highlights, suggesting modern technology, predictive analytics and big data focus.
Powered by 


0
downloads
downloads
Tags:
More
Credit Photo
If you would like to credit the Photo, here are some ways you can do so
Text Link
photo Link
<span class="text-link">
<span>
<a target="_blank" href=https://pikwizard.com/photo/businesswoman-analyzing-financial-charts-with-floating-3d-graphs-data-panels-and-laptop/4d4cc8a3e4da2c5d6347a508dfe6ee96/>PikWizard</a>
</span>
</span>
<span class="image-link">
<span
style="margin: 0 0 20px 0; display: inline-block; vertical-align: middle; width: 100%;"
>
<a
target="_blank"
href="https://pikwizard.com/photo/businesswoman-analyzing-financial-charts-with-floating-3d-graphs-data-panels-and-laptop/4d4cc8a3e4da2c5d6347a508dfe6ee96/"
style="text-decoration: none; font-size: 10px; margin: 0;"
>
<img src="https://pikwizard.com/pw/medium/4d4cc8a3e4da2c5d6347a508dfe6ee96.jpg" style="margin: 0; width: 100%;" alt="" />
<p style="font-size: 12px; margin: 0;">PikWizard</p>
</a>
</span>
</span>
Free (free of charge)
Free for personal and commercial use.
Author: Awesome Content
Similar Free Stock Images
Premium


Premium


Premium


Premium


Premium


Premium


Premium


Premium


Premium


Premium


Premium


Premium


Premium


Premium


Premium


Premium


Premium


Premium


Premium


Premium


Premium


Premium


Premium


Premium