- Home >
- Stock Photos >
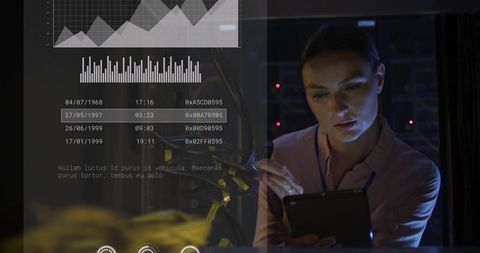
- Businesswoman Analyzing Financial Data on Cloud Interface
Businesswoman Analyzing Financial Data on Cloud Interface Image

Businesswoman working on laptop with overlay of charts and graphs, representing financial data processing. Ideal for illustrating modern business data analytics, financial technology solutions, or presentations on cloud-based data tools.

downloads
Tags:
More
Credit Photo
If you would like to credit the Photo, here are some ways you can do so
Text Link
photo Link
<span class="text-link">
<span>
<a target="_blank" href=https://pikwizard.com/photo/businesswoman-analyzing-financial-data-on-cloud-interface/7d42640bcf2d8689df407a33300a67dd/>PikWizard</a>
</span>
</span>
<span class="image-link">
<span
style="margin: 0 0 20px 0; display: inline-block; vertical-align: middle; width: 100%;"
>
<a
target="_blank"
href="https://pikwizard.com/photo/businesswoman-analyzing-financial-data-on-cloud-interface/7d42640bcf2d8689df407a33300a67dd/"
style="text-decoration: none; font-size: 10px; margin: 0;"
>
<img src="https://pikwizard.com/pw/medium/7d42640bcf2d8689df407a33300a67dd.jpg" style="margin: 0; width: 100%;" alt="" />
<p style="font-size: 12px; margin: 0;">PikWizard</p>
</a>
</span>
</span>
Free (free of charge)
Free for personal and commercial use.
Author: People Creations