- Home >
- Stock Photos >
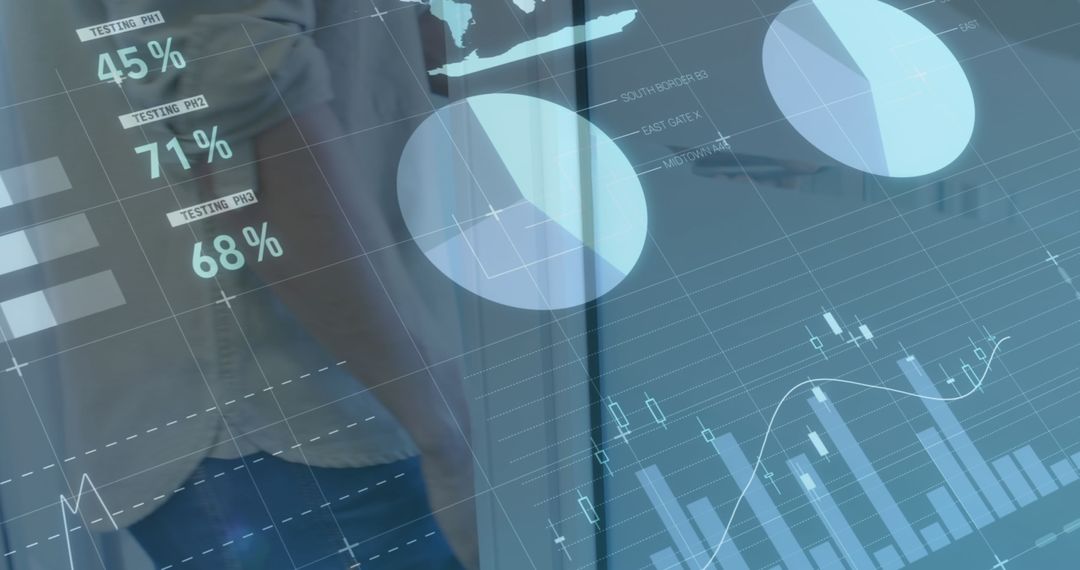
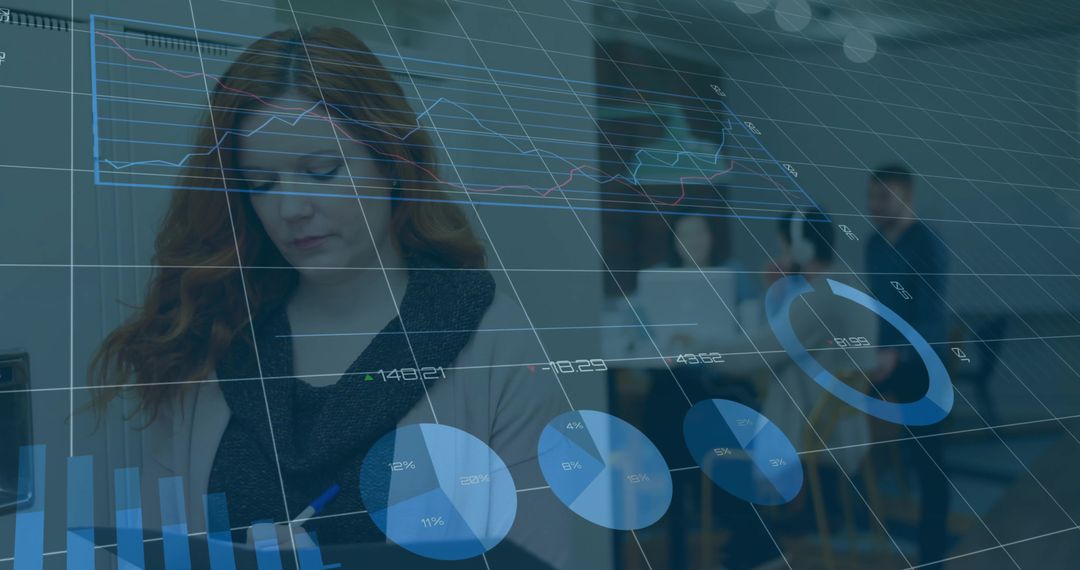
- Businesswoman Analyzing Financial Graphs and Data on Smartphone
Businesswoman Analyzing Financial Graphs and Data on Smartphone Image

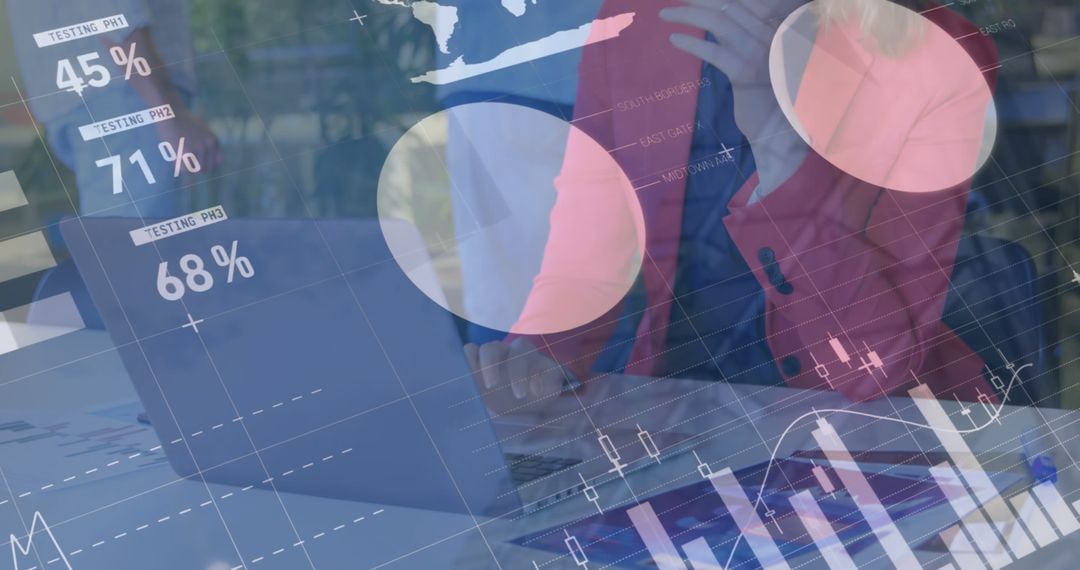
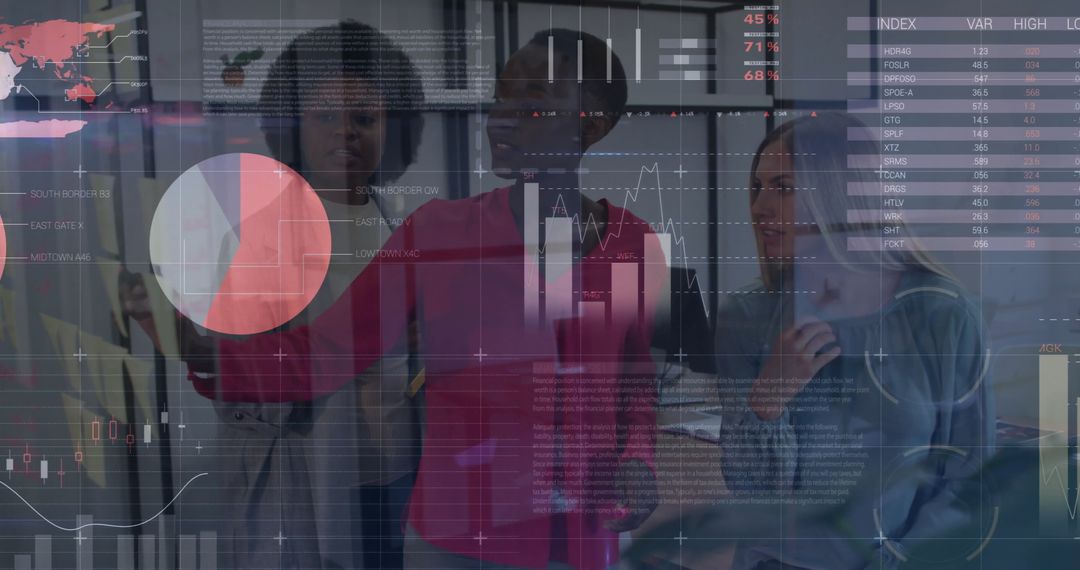
This visual presents a compilation of digital financial graphs and data overlaid on a businesswoman in an office setting using her smartphone. Useful for articles on business analysis, financial technology advancements, and corporate strategy. Perfect for illustrating concepts in the finance or business industries, especially focusing on data-driven decision-making and technological integration.
Powered by  - Get 15% off with code: PIKWIZARD15


0
downloads
downloads
Tags:
More
Credit Photo
If you would like to credit the Photo, here are some ways you can do so
Text Link
photo Link
<span class="text-link">
<span>
<a target="_blank" href=https://pikwizard.com/photo/businesswoman-analyzing-financial-graphs-and-data-on-smartphone/ab4c70a2452945c7eb0c2a1aa2a9bb71/>PikWizard</a>
</span>
</span>
<span class="image-link">
<span
style="margin: 0 0 20px 0; display: inline-block; vertical-align: middle; width: 100%;"
>
<a
target="_blank"
href="https://pikwizard.com/photo/businesswoman-analyzing-financial-graphs-and-data-on-smartphone/ab4c70a2452945c7eb0c2a1aa2a9bb71/"
style="text-decoration: none; font-size: 10px; margin: 0;"
>
<img src="https://pikwizard.com/pw/medium/ab4c70a2452945c7eb0c2a1aa2a9bb71.jpg" style="margin: 0; width: 100%;" alt="" />
<p style="font-size: 12px; margin: 0;">PikWizard</p>
</a>
</span>
</span>
Free (free of charge)
Free for personal and commercial use.
Author: People Creations
Similar Free Stock Images

Premium


Premium


Premium


Premium


Premium


Premium


Premium


Premium


Premium


Premium


Premium


Premium


Premium


Premium


Premium


Premium


Premium


Premium


Premium


Premium


Premium


Premium


Premium


Premium