- Home >
- Stock Photos >
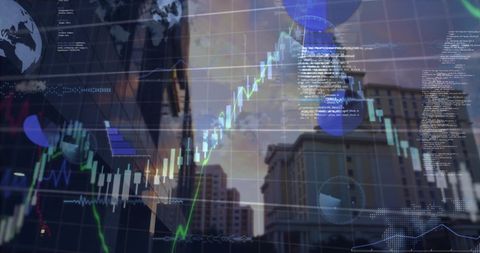
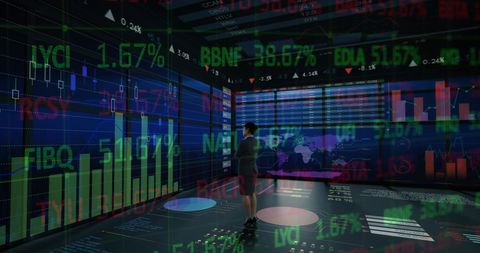
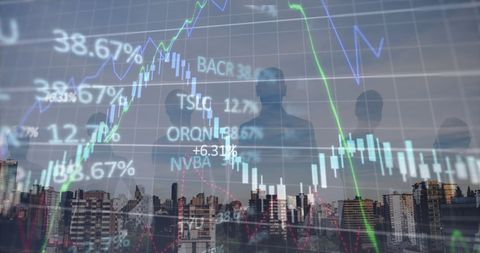
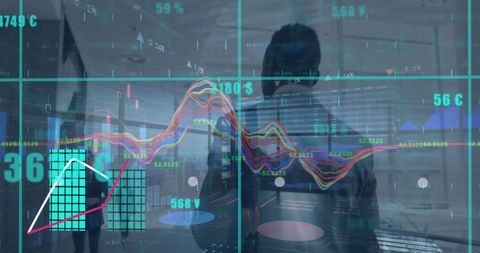
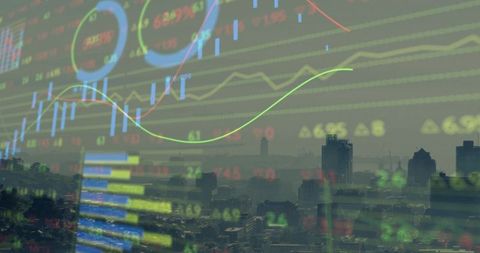
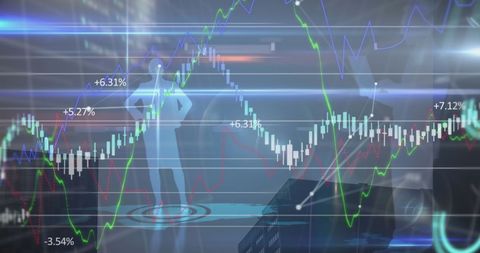
- Businesswoman Analyzing Virtual Financial Data for Global Markets
Businesswoman Analyzing Virtual Financial Data for Global Markets Image

Businesswoman stands in immersive digital environment analyzing financial data visualizations, representing advanced market analytics and decision-making processes. Suitable for illustrating concepts of the global economy, technology-driven finance, business strategy, or corporate leadership.
Powered by  - Get 15% off with code: PIKWIZARD15


2
downloads
downloads
Tags:
More
Credit Photo
If you would like to credit the Photo, here are some ways you can do so
Text Link
photo Link
<span class="text-link">
<span>
<a target="_blank" href=https://pikwizard.com/photo/businesswoman-analyzing-virtual-financial-data-for-global-markets/c50f280af7aff044f770c7d0765947ef/>PikWizard</a>
</span>
</span>
<span class="image-link">
<span
style="margin: 0 0 20px 0; display: inline-block; vertical-align: middle; width: 100%;"
>
<a
target="_blank"
href="https://pikwizard.com/photo/businesswoman-analyzing-virtual-financial-data-for-global-markets/c50f280af7aff044f770c7d0765947ef/"
style="text-decoration: none; font-size: 10px; margin: 0;"
>
<img src="https://pikwizard.com/pw/medium/c50f280af7aff044f770c7d0765947ef.jpg" style="margin: 0; width: 100%;" alt="" />
<p style="font-size: 12px; margin: 0;">PikWizard</p>
</a>
</span>
</span>
Free (free of charge)
Free for personal and commercial use.
Author: People Creations
Similar Free Stock Images
Loading...

Premium


Premium


Premium

Premium


Premium

Premium


Premium
Premium


Premium


Premium

Premium


Premium


Premium


Premium


Premium

Premium


Premium


Premium


Premium


Premium

Premium

Premium


Premium


Premium


Premium