- Home >
- Stock Photos >
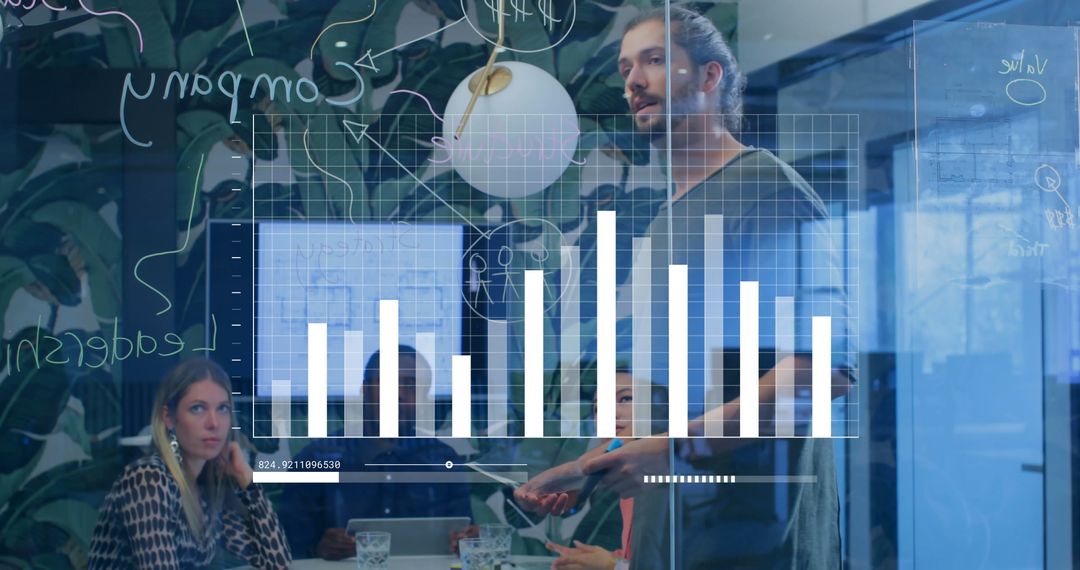
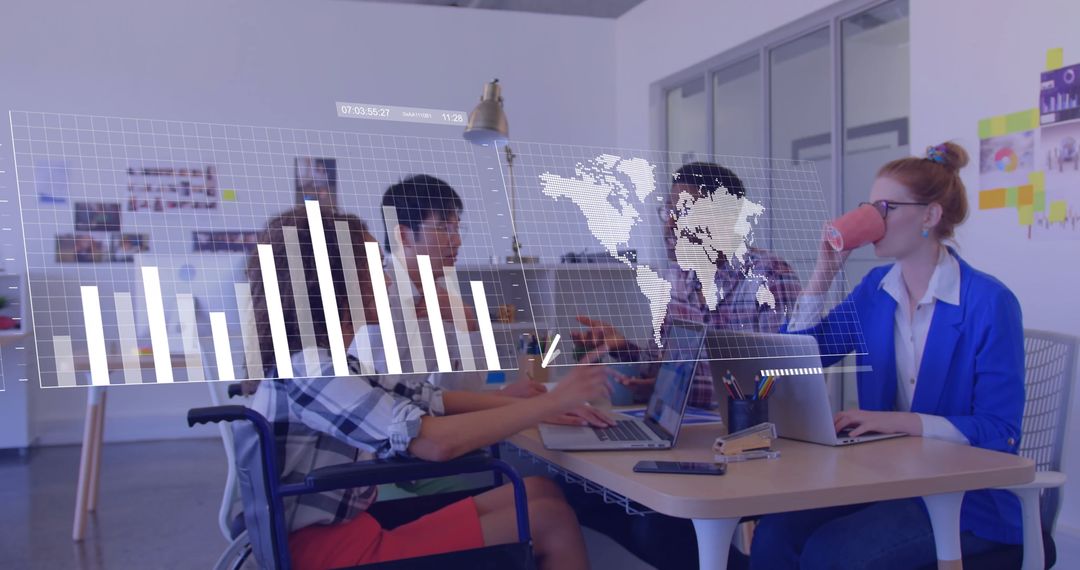
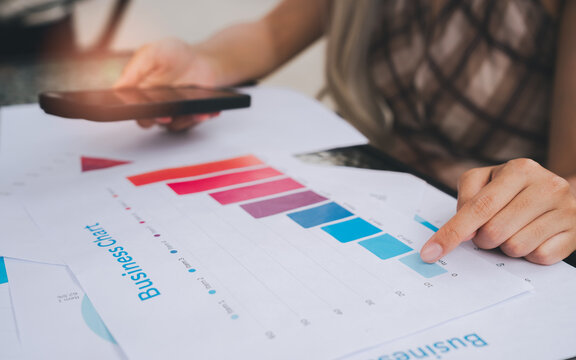
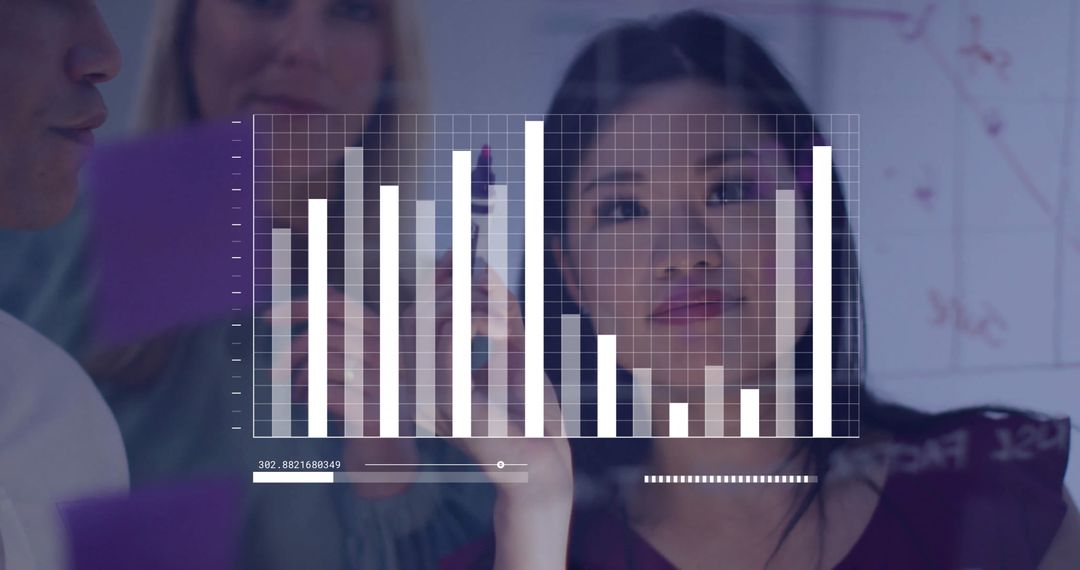
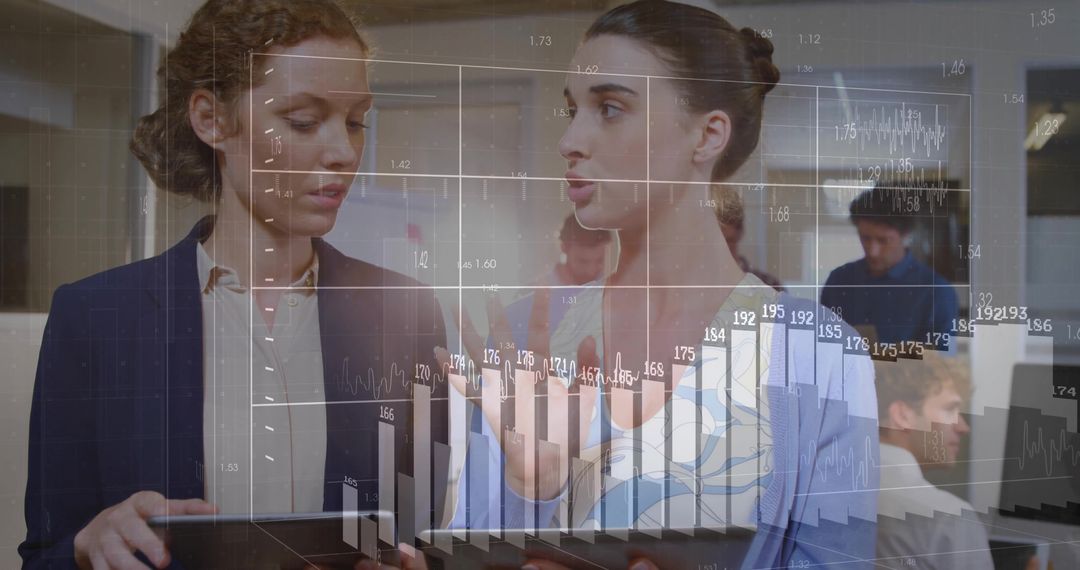
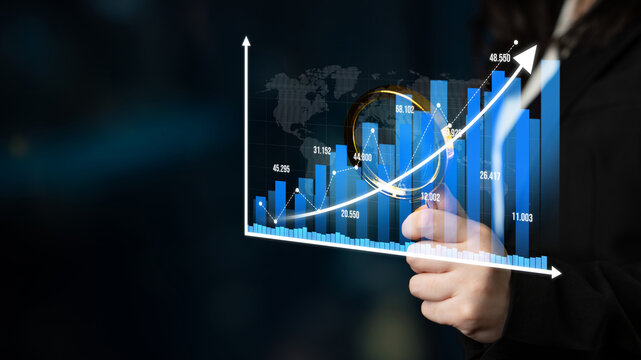
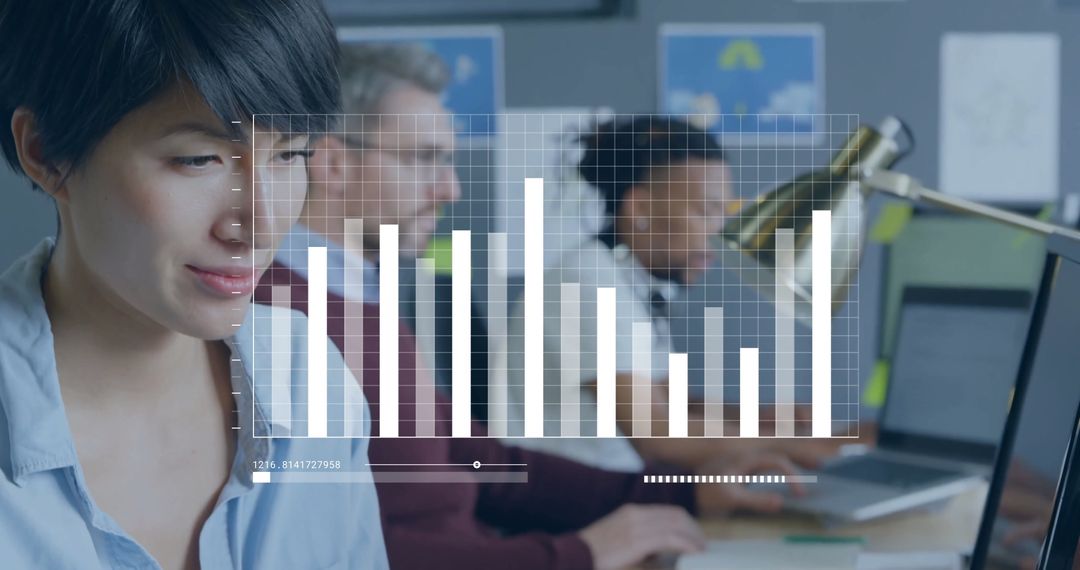
- Businesswoman Presenting Data Analytics Chart in Meeting
Businesswoman Presenting Data Analytics Chart in Meeting Image

Businesswoman in contemporary office presents analytics with bar chart illustration. Ideal for use in business presentations, educational insights about statistics, or articles on data-driven strategies. Captures modern teaching techniques and workplace innovation.
Powered by 


2
downloads
downloads
Tags:
More
Credit Photo
If you would like to credit the Photo, here are some ways you can do so
Text Link
photo Link
<span class="text-link">
<span>
<a target="_blank" href=https://pikwizard.com/photo/businesswoman-presenting-data-analytics-chart-in-meeting/e8c4d3602e0d4262e2954e92f6923ee0/>PikWizard</a>
</span>
</span>
<span class="image-link">
<span
style="margin: 0 0 20px 0; display: inline-block; vertical-align: middle; width: 100%;"
>
<a
target="_blank"
href="https://pikwizard.com/photo/businesswoman-presenting-data-analytics-chart-in-meeting/e8c4d3602e0d4262e2954e92f6923ee0/"
style="text-decoration: none; font-size: 10px; margin: 0;"
>
<img src="https://pikwizard.com/pw/medium/e8c4d3602e0d4262e2954e92f6923ee0.jpg" style="margin: 0; width: 100%;" alt="" />
<p style="font-size: 12px; margin: 0;">PikWizard</p>
</a>
</span>
</span>
Free (free of charge)
Free for personal and commercial use.
Author: Awesome Content
Similar Free Stock Images
Premium


Premium


Premium


Premium


Premium


Premium


Premium


Premium


Premium


Premium


Premium


Premium


Premium


Premium


Premium


Premium


Premium


Premium


Premium


Premium


Premium


Premium


Premium


Premium