- Home >
- Stock Photos >
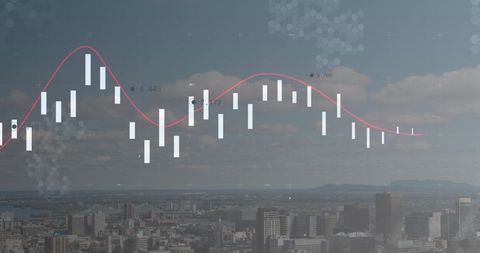
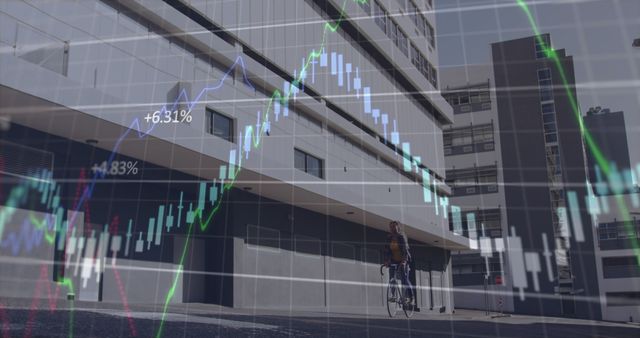
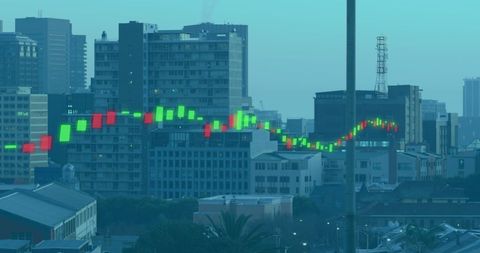
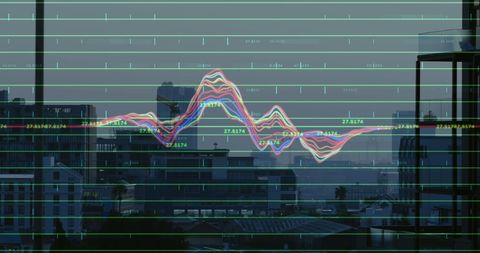
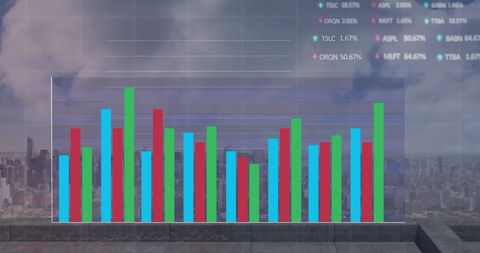
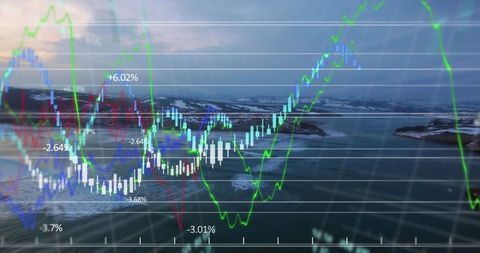
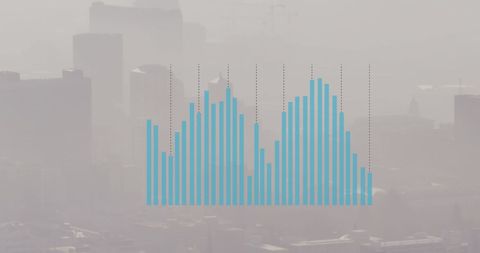
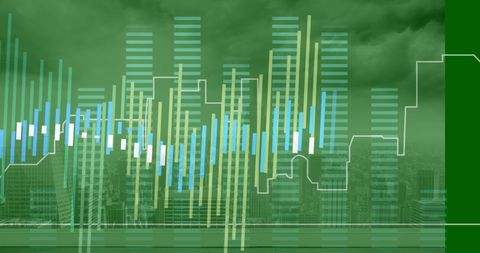
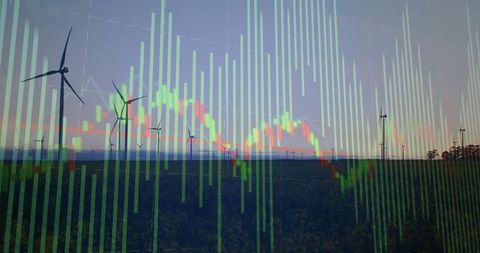
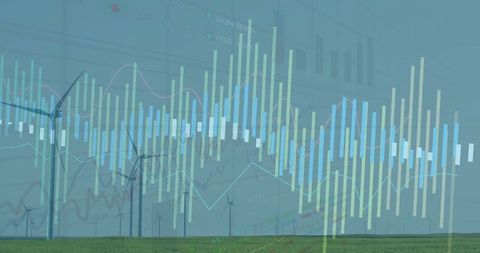
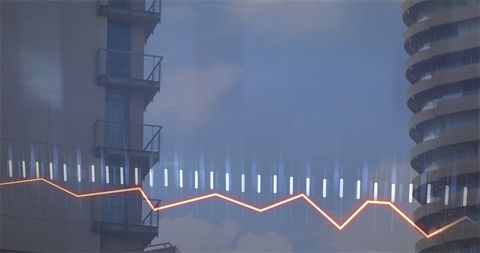
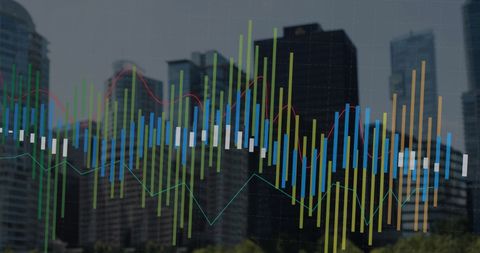
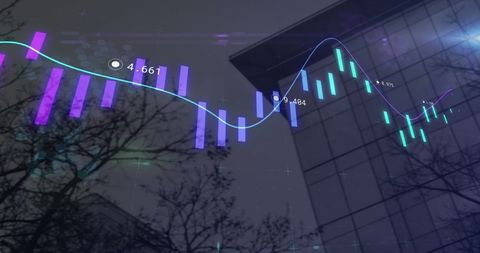
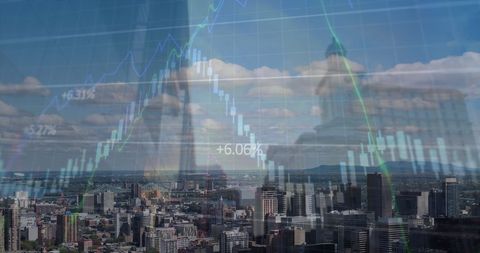
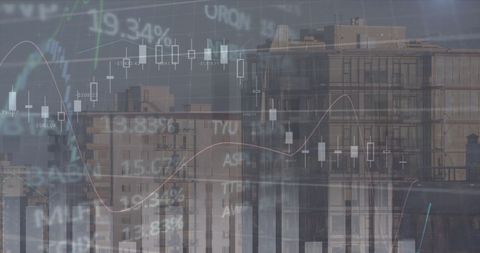
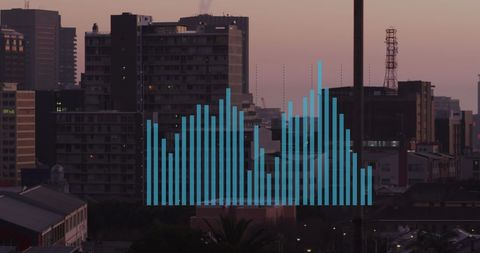
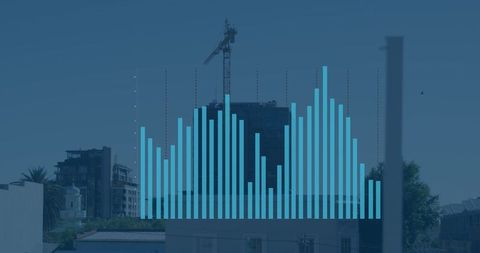
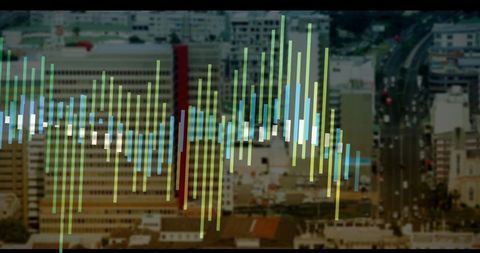
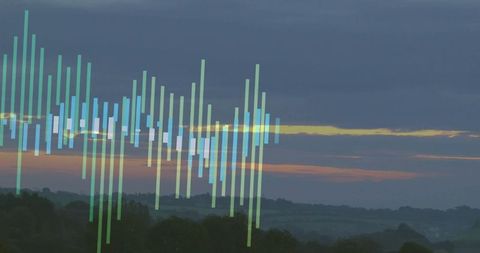
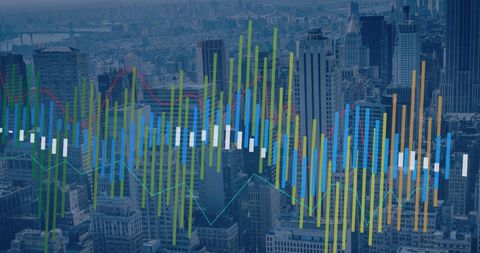
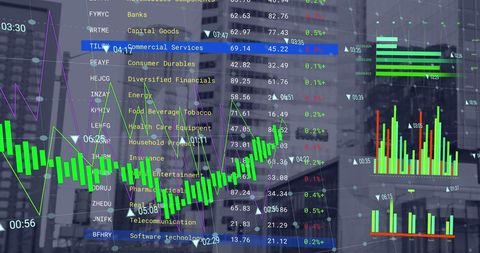
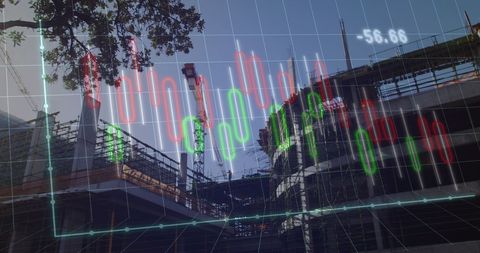
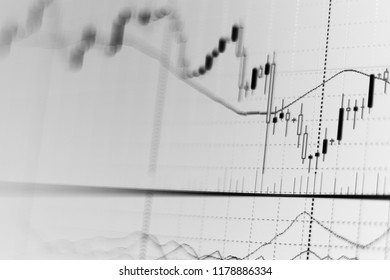
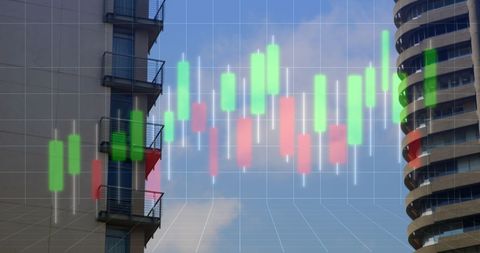
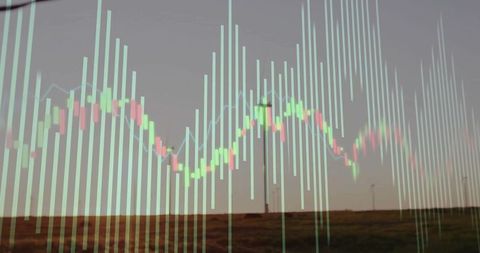
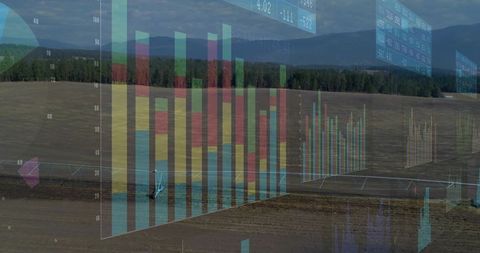
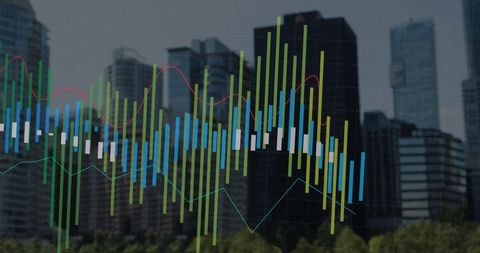
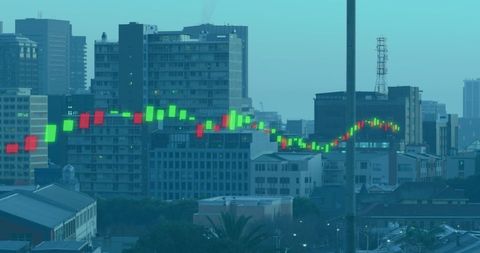
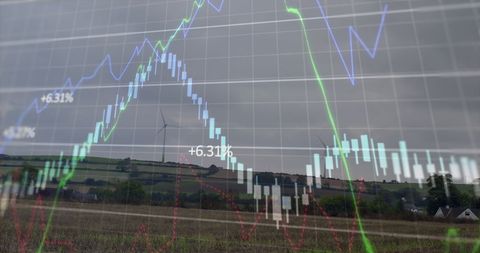
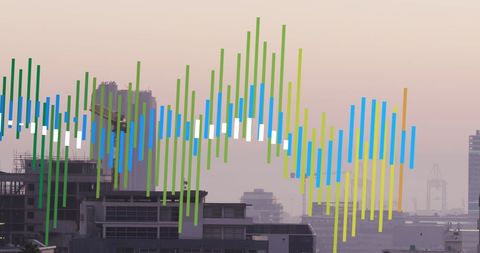
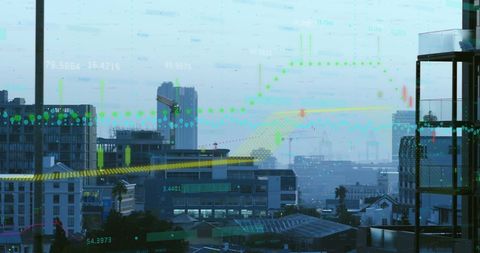
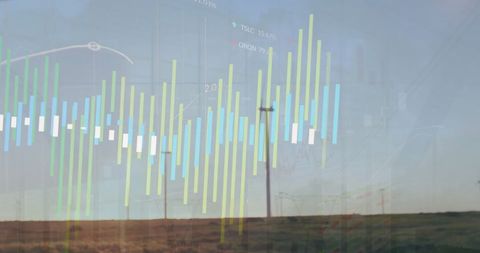
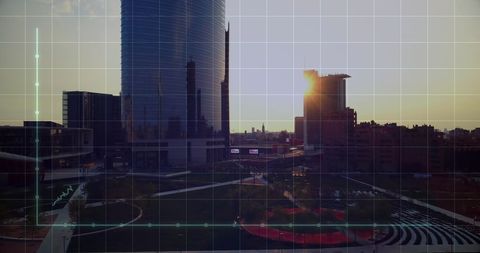
- Candle Stick Chart Overlay on Modern City Buildings
Candle Stick Chart Overlay on Modern City Buildings Image
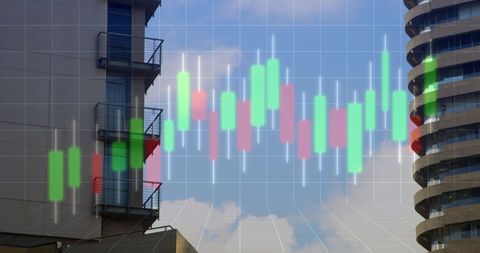
This visualization merges stock market analysis with urban architecture, depicting volatility and economic trends superimposed on skyscrapers. Useful for articles on finance, business trends, real estate investment, and urban development.
Powered by  - Get 15% off with code: PIKWIZARD15


2
downloads
downloads
Tags:
More
Credit Photo
If you would like to credit the Photo, here are some ways you can do so
Text Link
photo Link
<span class="text-link">
<span>
<a target="_blank" href=https://pikwizard.com/photo/candle-stick-chart-overlay-on-modern-city-buildings/eb74ab36ee269bc54bebd8ecdd44c89c/>PikWizard</a>
</span>
</span>
<span class="image-link">
<span
style="margin: 0 0 20px 0; display: inline-block; vertical-align: middle; width: 100%;"
>
<a
target="_blank"
href="https://pikwizard.com/photo/candle-stick-chart-overlay-on-modern-city-buildings/eb74ab36ee269bc54bebd8ecdd44c89c/"
style="text-decoration: none; font-size: 10px; margin: 0;"
>
<img src="https://pikwizard.com/pw/medium/eb74ab36ee269bc54bebd8ecdd44c89c.jpg" style="margin: 0; width: 100%;" alt="" />
<p style="font-size: 12px; margin: 0;">PikWizard</p>
</a>
</span>
</span>
Free (free of charge)
Free for personal and commercial use.
Author: Awesome Content
Similar Free Stock Images
Loading...
Premium


Premium


Premium


Premium


Premium


Premium


Premium

Premium


Premium


Premium


Premium

Premium

Premium


Premium
Premium

Premium
Premium


Premium


Premium


Premium


Premium

Premium


Premium


Premium


Premium