- Home >
- Stock Photos >
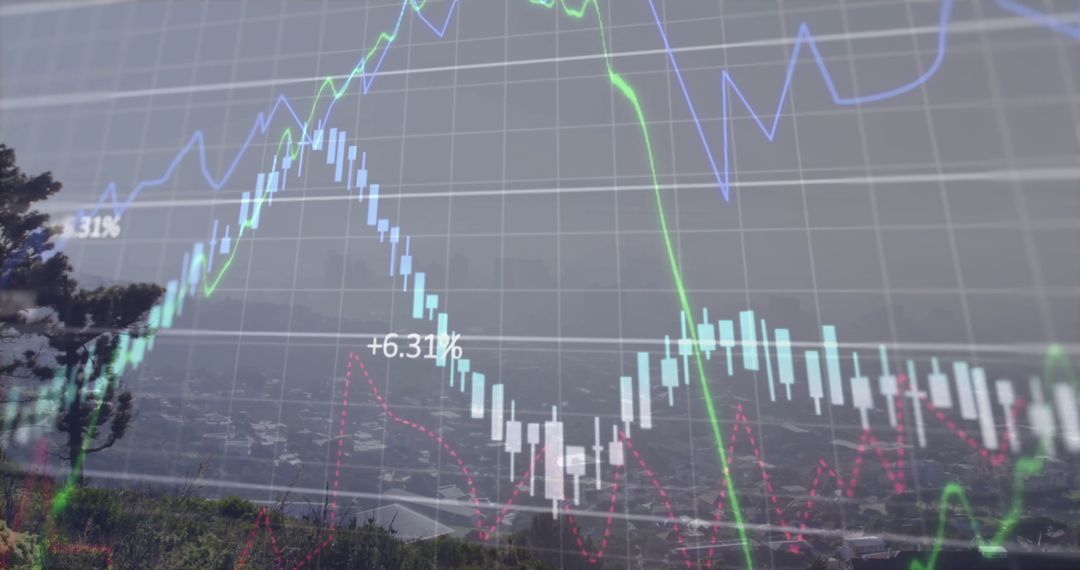
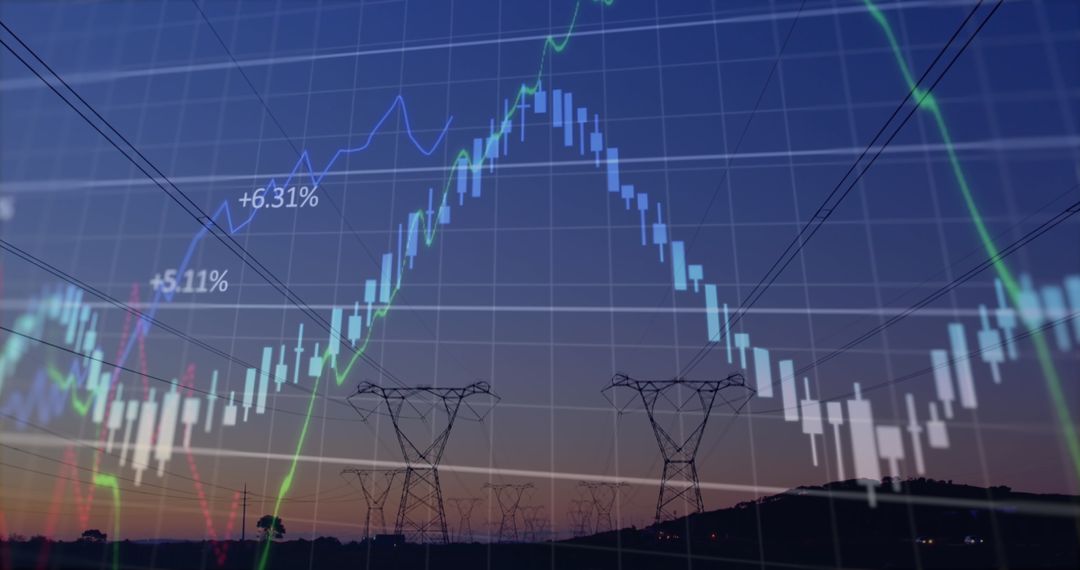
- Candlestick and line market chart visualizing stock performance with percentage gain labels
Candlestick and line market chart visualizing stock performance with percentage gain labels Image

Displaying candlestick bars, colored line graphs, and percentage labels for clear presentation of price movement and trend signals. Perfect for illustrating market trends in financial reports, investor presentations, trading platform mockups, fintech websites, blog headers, and social media posts. Helping designers and analysts communicate technical analysis concepts such as support and resistance, bullish and bearish patterns, and percentage gains. Working well for marketing materials, editorial content, training resources, and app UI prototypes where clear numeric labels and visual hierarchy are required. Providing space for overlaying custom logos, headlines, or data callouts in post-production. Delivering crisp contrast with blue and green tones that read well on both light and dark themes.
Powered by 


0
downloads
downloads
Tags:
More
Credit Photo
If you would like to credit the Photo, here are some ways you can do so
Text Link
photo Link
<span class="text-link">
<span>
<a target="_blank" href=https://pikwizard.com/photo/candlestick-and-line-market-chart-visualizing-stock-performance-with-percentage-gain-labels/eb3ad5042701db2eb71e1cce4e249292/>PikWizard</a>
</span>
</span>
<span class="image-link">
<span
style="margin: 0 0 20px 0; display: inline-block; vertical-align: middle; width: 100%;"
>
<a
target="_blank"
href="https://pikwizard.com/photo/candlestick-and-line-market-chart-visualizing-stock-performance-with-percentage-gain-labels/eb3ad5042701db2eb71e1cce4e249292/"
style="text-decoration: none; font-size: 10px; margin: 0;"
>
<img src="https://pikwizard.com/pw/medium/eb3ad5042701db2eb71e1cce4e249292.jpg" style="margin: 0; width: 100%;" alt="" />
<p style="font-size: 12px; margin: 0;">PikWizard</p>
</a>
</span>
</span>
Free (free of charge)
Free for personal and commercial use.
Author: People Creations
Similar Free Stock Images

Premium


Premium


Premium


Premium


Premium


Premium


Premium


Premium


Premium


Premium


Premium


Premium


Premium


Premium


Premium


Premium


Premium


Premium


Premium


Premium


Premium


Premium


Premium


Premium