- Home >
- Stock Photos >
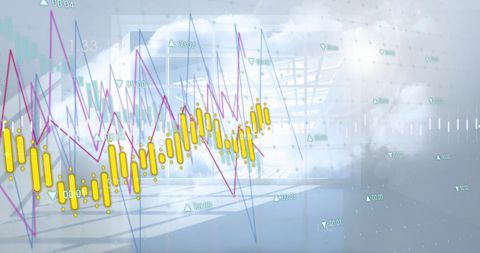
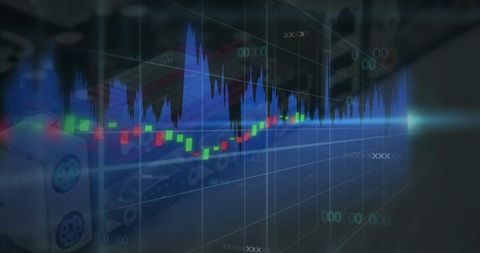
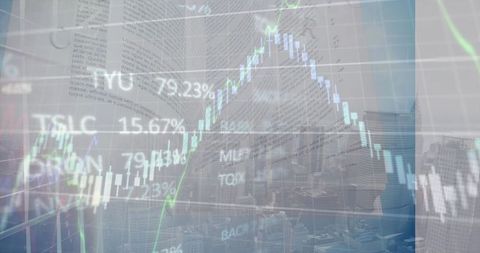
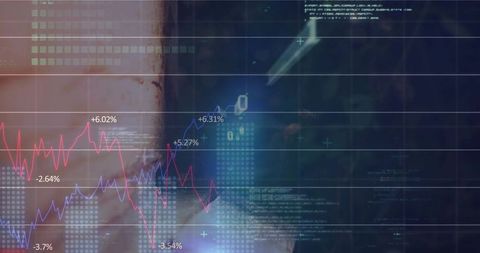
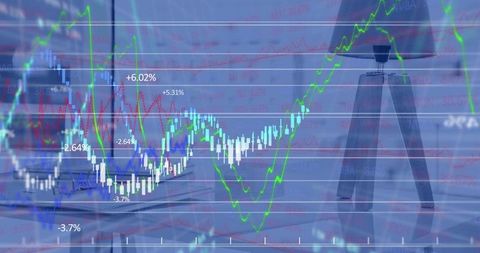
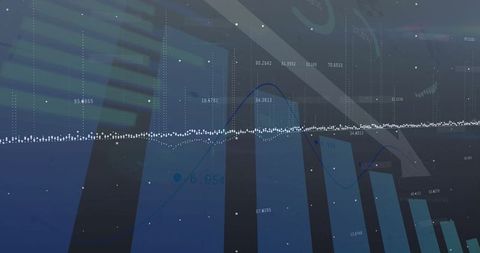
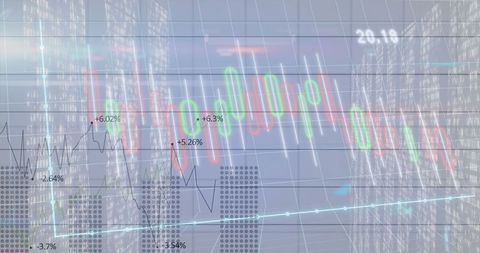
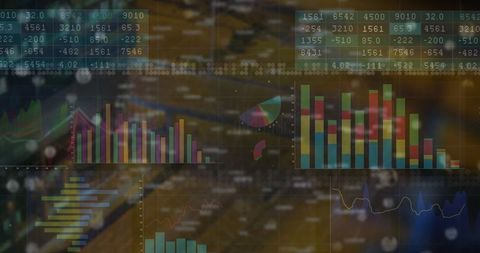
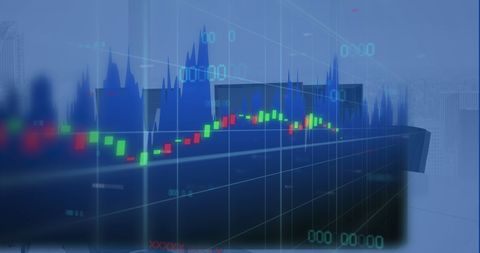
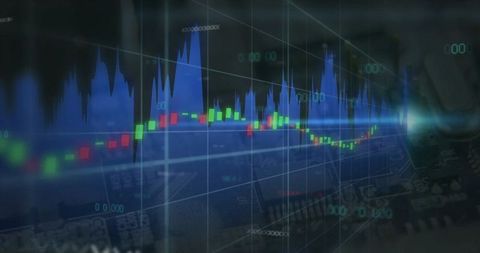
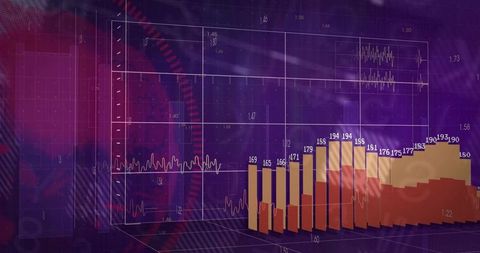
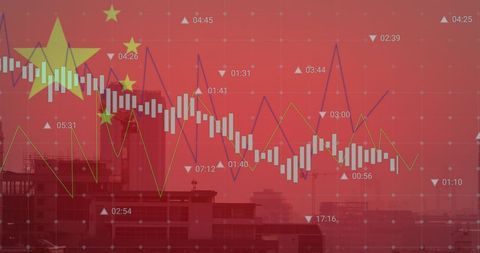
- Candlestick Chart and Line Graph in Digital Interface on Textured Backdrop
Candlestick Chart and Line Graph in Digital Interface on Textured Backdrop Image
Candlestick chart with line graph overlay emphasizes dynamic data reading and financial analysis. Ideal for content related to investment strategies, digital technology integration in the financial sector, and cybersecurity solutions. Suited for tech conferences, finance-oriented educational materials, and innovation-driven business presentations.

downloads
Tags:
More
Credit Photo
If you would like to credit the Photo, here are some ways you can do so
Text Link
photo Link
<span class="text-link">
<span>
<a target="_blank" href=https://pikwizard.com/photo/candlestick-chart-and-line-graph-in-digital-interface-on-textured-backdrop/030a30f5b63f923490c52f1f221d03df/>PikWizard</a>
</span>
</span>
<span class="image-link">
<span
style="margin: 0 0 20px 0; display: inline-block; vertical-align: middle; width: 100%;"
>
<a
target="_blank"
href="https://pikwizard.com/photo/candlestick-chart-and-line-graph-in-digital-interface-on-textured-backdrop/030a30f5b63f923490c52f1f221d03df/"
style="text-decoration: none; font-size: 10px; margin: 0;"
>
<img src="https://pikwizard.com/pw/medium/030a30f5b63f923490c52f1f221d03df.jpg" style="margin: 0; width: 100%;" alt="" />
<p style="font-size: 12px; margin: 0;">PikWizard</p>
</a>
</span>
</span>
Free (free of charge)
Free for personal and commercial use.
Author: Awesome Content