- Home >
- Stock Photos >
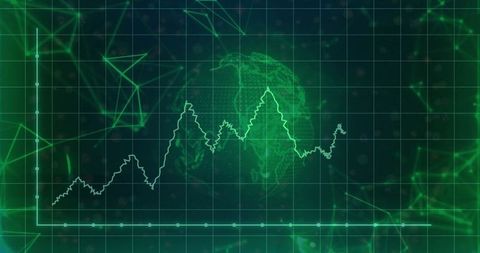
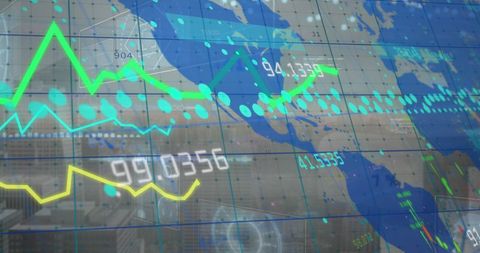
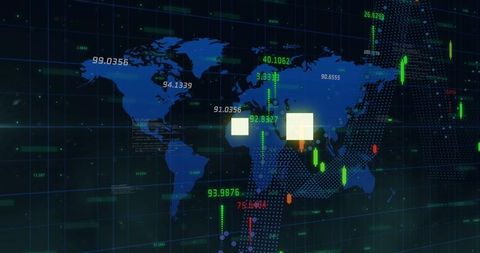
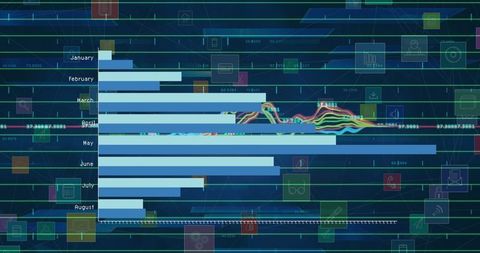
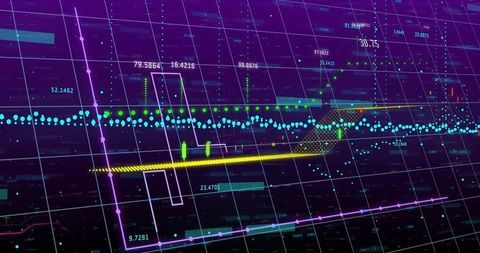
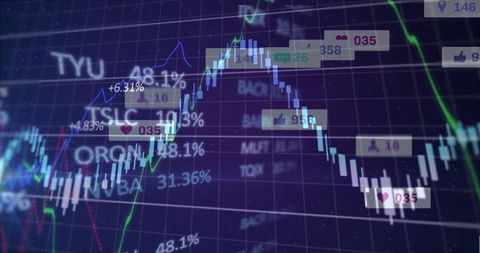
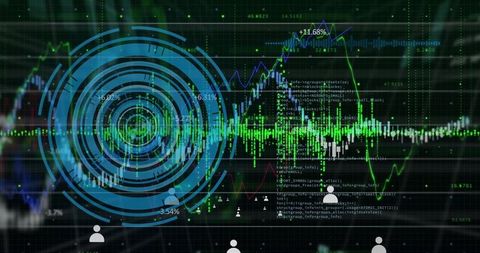
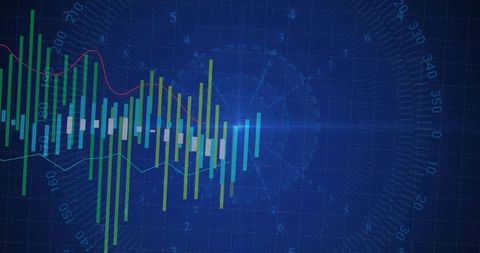
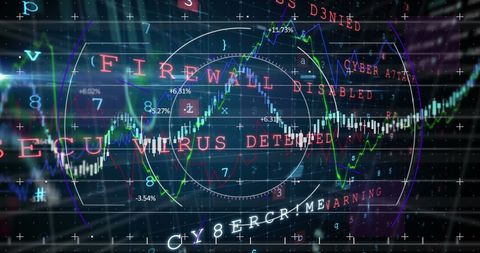
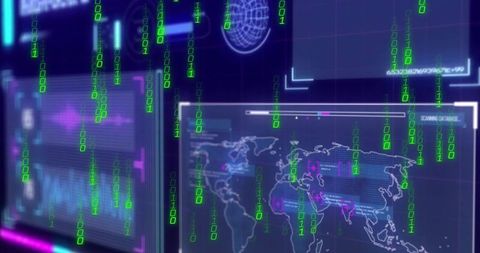
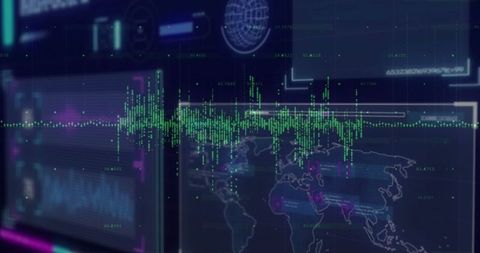
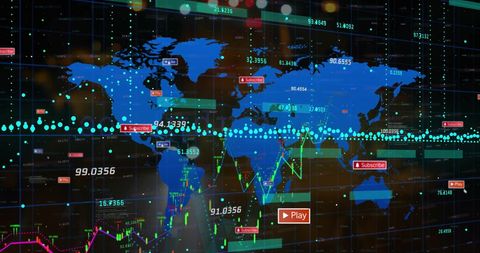
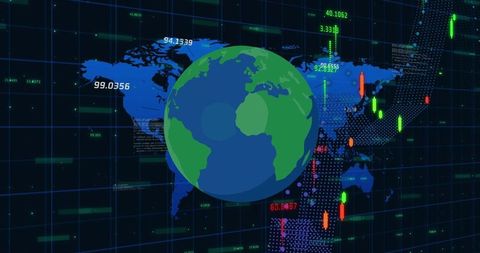
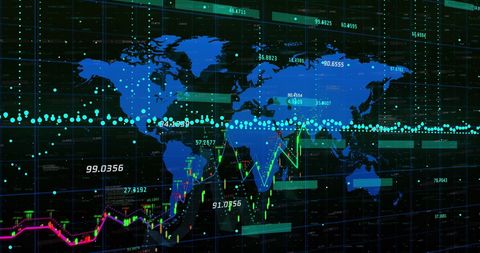
- Candlestick Chart with Binary Code and Percent Indicators on Trading Screen
Candlestick Chart with Binary Code and Percent Indicators on Trading Screen Image

Visual showcases candlestick chart superimposed with binary code and percentage indicators, representing dynamic stock market analytics often used in finance, investment technology, or data visualization contexts. Ideal for illustrating topics related to financial technology trends and digital data analysis frameworks.

downloads
Tags:
More
Credit Photo
If you would like to credit the Photo, here are some ways you can do so
Text Link
photo Link
<span class="text-link">
<span>
<a target="_blank" href=https://pikwizard.com/photo/candlestick-chart-with-binary-code-and-percent-indicators-on-trading-screen/818c1120c2de5c5be928230b8958383e/>PikWizard</a>
</span>
</span>
<span class="image-link">
<span
style="margin: 0 0 20px 0; display: inline-block; vertical-align: middle; width: 100%;"
>
<a
target="_blank"
href="https://pikwizard.com/photo/candlestick-chart-with-binary-code-and-percent-indicators-on-trading-screen/818c1120c2de5c5be928230b8958383e/"
style="text-decoration: none; font-size: 10px; margin: 0;"
>
<img src="https://pikwizard.com/pw/medium/818c1120c2de5c5be928230b8958383e.jpg" style="margin: 0; width: 100%;" alt="" />
<p style="font-size: 12px; margin: 0;">PikWizard</p>
</a>
</span>
</span>
Free (free of charge)
Free for personal and commercial use.
Author: Awesome Content