
- Home >
- Stock Photos >
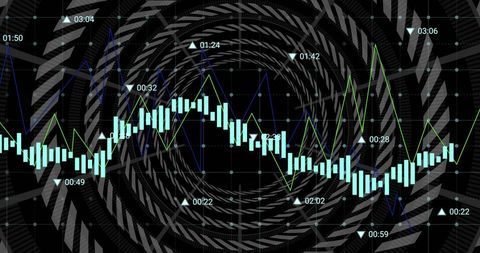
- Candlestick Chart with Circular Abstract Data Visualization
Candlestick Chart with Circular Abstract Data Visualization Image
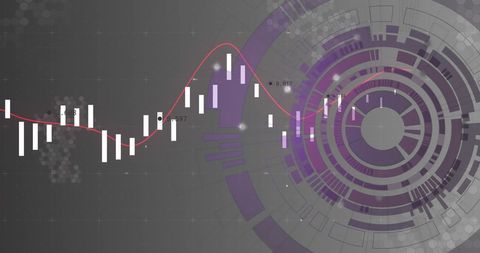
Image showcases candlestick chart over abstract circular design, symbolizing modern stock market analysis. Useful for illustrating financial trends, data analytics, and investment growth in presentations or articles about finance and technology advancements.
Powered by  - Get 15% off with code: PIKWIZARD15


downloads
Tags:
More
Credit Photo
If you would like to credit the Photo, here are some ways you can do so
Text Link
photo Link
<span class="text-link">
<span>
<a target="_blank" href=https://pikwizard.com/photo/candlestick-chart-with-circular-abstract-data-visualization/8c6ebc31cedaf8287b5ffab1af443012/>PikWizard</a>
</span>
</span>
<span class="image-link">
<span
style="margin: 0 0 20px 0; display: inline-block; vertical-align: middle; width: 100%;"
>
<a
target="_blank"
href="https://pikwizard.com/photo/candlestick-chart-with-circular-abstract-data-visualization/8c6ebc31cedaf8287b5ffab1af443012/"
style="text-decoration: none; font-size: 10px; margin: 0;"
>
<img src="https://pikwizard.com/pw/medium/8c6ebc31cedaf8287b5ffab1af443012.jpg" style="margin: 0; width: 100%;" alt="" />
<p style="font-size: 12px; margin: 0;">PikWizard</p>
</a>
</span>
</span>
Free (free of charge)
Free for personal and commercial use.
Author: Creative Art
Similar Free Stock Images

Premium


Premium


Premium

Premium

Premium


Premium


Premium


Premium


Premium

Premium


Premium


Premium


Premium


Premium


Premium


Premium


Premium


Premium


Premium

Premium

Premium

Premium


Premium

Premium


Premium


Explore More Free Stock Images