- Home >
- Stock Photos >
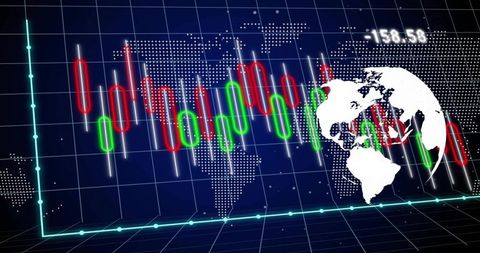
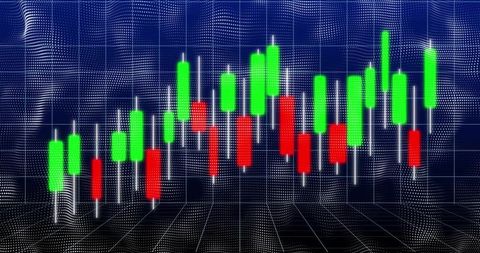
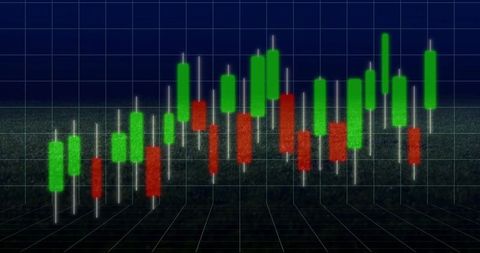
- Candlestick Chart with Financial Data on Grid Background
Candlestick Chart with Financial Data on Grid Background Image
Candlestick chart emerging from a grid background, signifying active financial and stock market analysis. Green and red bars display fluctuating market trends and economic data. Useful for topics in finance, trading analysis, and investment insight, modern technological interfaces or business presentations focusing on market data interpretation.

downloads
Tags:
More
Credit Photo
If you would like to credit the Photo, here are some ways you can do so
Text Link
photo Link
<span class="text-link">
<span>
<a target="_blank" href=https://pikwizard.com/photo/candlestick-chart-with-financial-data-on-grid-background/03b2521ab03e297b9c0fc256bfcadc56/>PikWizard</a>
</span>
</span>
<span class="image-link">
<span
style="margin: 0 0 20px 0; display: inline-block; vertical-align: middle; width: 100%;"
>
<a
target="_blank"
href="https://pikwizard.com/photo/candlestick-chart-with-financial-data-on-grid-background/03b2521ab03e297b9c0fc256bfcadc56/"
style="text-decoration: none; font-size: 10px; margin: 0;"
>
<img src="https://pikwizard.com/pw/medium/03b2521ab03e297b9c0fc256bfcadc56.jpg" style="margin: 0; width: 100%;" alt="" />
<p style="font-size: 12px; margin: 0;">PikWizard</p>
</a>
</span>
</span>
Free (free of charge)
Free for personal and commercial use.
Author: Awesome Content