
- Home >
- Stock Photos >
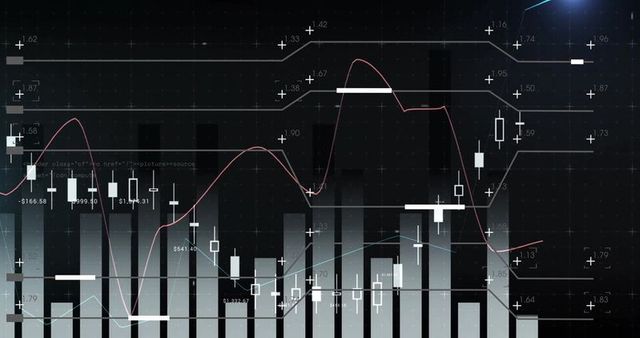
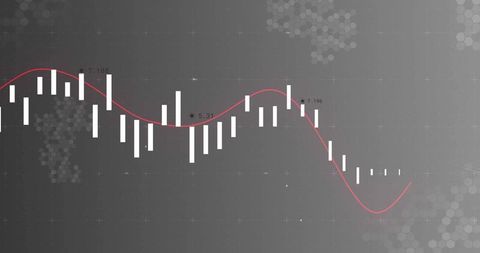
- Candlestick Chart with Moving Averages on Dark Background
Candlestick Chart with Moving Averages on Dark Background Image

Candlestick chart with moving average lines represents detailed stock market trends and trading data, ideal for use in financial analysis reports, stock market related presentations, and educational materials. Perfect for traders, financial analysts, and investment advisors looking to illustrate market movements and trends clearly and effectively.
Powered by  - Get 15% off with code: PIKWIZARD15


downloads
Tags:
More
Credit Photo
If you would like to credit the Photo, here are some ways you can do so
Text Link
photo Link
<span class="text-link">
<span>
<a target="_blank" href=https://pikwizard.com/photo/candlestick-chart-with-moving-averages-on-dark-background/07101ffaead0442139697a8746d493fd/>PikWizard</a>
</span>
</span>
<span class="image-link">
<span
style="margin: 0 0 20px 0; display: inline-block; vertical-align: middle; width: 100%;"
>
<a
target="_blank"
href="https://pikwizard.com/photo/candlestick-chart-with-moving-averages-on-dark-background/07101ffaead0442139697a8746d493fd/"
style="text-decoration: none; font-size: 10px; margin: 0;"
>
<img src="https://pikwizard.com/pw/medium/07101ffaead0442139697a8746d493fd.jpg" style="margin: 0; width: 100%;" alt="" />
<p style="font-size: 12px; margin: 0;">PikWizard</p>
</a>
</span>
</span>
Free (free of charge)
Free for personal and commercial use.
Author: People Creations
Similar Free Stock Images
Loading...

Premium


Premium


Premium


Premium


Premium

Premium


Premium


Premium


Premium


Premium


Premium


Premium

Premium

Premium


Premium


Premium


Premium


Premium


Premium

Premium

Premium


Premium

Premium


Premium
Premium

