- Home >
- Stock Photos >
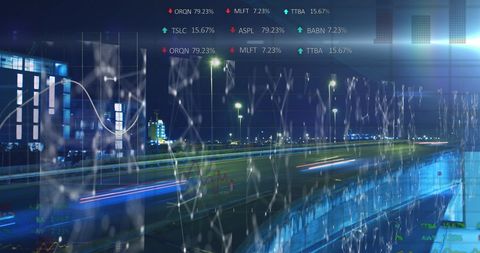
- Candlestick Graph Over City Night Traffic for Stock Market Concept
Candlestick Graph Over City Night Traffic for Stock Market Concept Image

Candlestick charts blend with a bustling city's night traffic on multi-lane highways, producing vibrant red and white light trails symbolizing activity and movement. The intertwining visuals of finance and transport typify economic dynamism and urban progress. Ideal for illustrating financial reports, business presentations, or advertisement material on platforms covering urban development, economic analysis, or technology infrastructure.
Powered by 


downloads
Tags:
More
Credit Photo
If you would like to credit the Photo, here are some ways you can do so
Text Link
photo Link
<span class="text-link">
<span>
<a target="_blank" href=https://pikwizard.com/photo/candlestick-graph-over-city-night-traffic-for-stock-market-concept/22d9f871e754cc3d1e16b3ec73e754c4/>PikWizard</a>
</span>
</span>
<span class="image-link">
<span
style="margin: 0 0 20px 0; display: inline-block; vertical-align: middle; width: 100%;"
>
<a
target="_blank"
href="https://pikwizard.com/photo/candlestick-graph-over-city-night-traffic-for-stock-market-concept/22d9f871e754cc3d1e16b3ec73e754c4/"
style="text-decoration: none; font-size: 10px; margin: 0;"
>
<img src="https://pikwizard.com/pw/medium/22d9f871e754cc3d1e16b3ec73e754c4.jpg" style="margin: 0; width: 100%;" alt="" />
<p style="font-size: 12px; margin: 0;">PikWizard</p>
</a>
</span>
</span>
Free (free of charge)
Free for personal and commercial use.
Author: Authentic Images
Similar Free Stock Images
Loading...

Premium


Premium


Premium


Premium

Premium


Premium

Premium

Premium


Premium


Premium

Premium


Premium


Premium


Premium


Premium


Premium


Premium


Premium

Premium

Premium

Premium


Premium


Premium


Premium

Premium