- Home >
- Stock Photos >
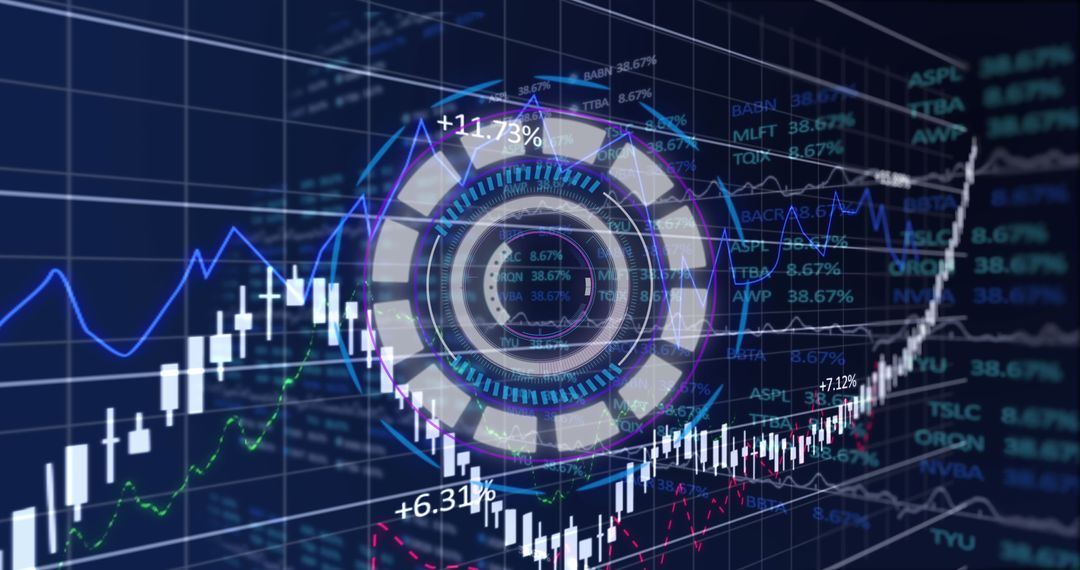
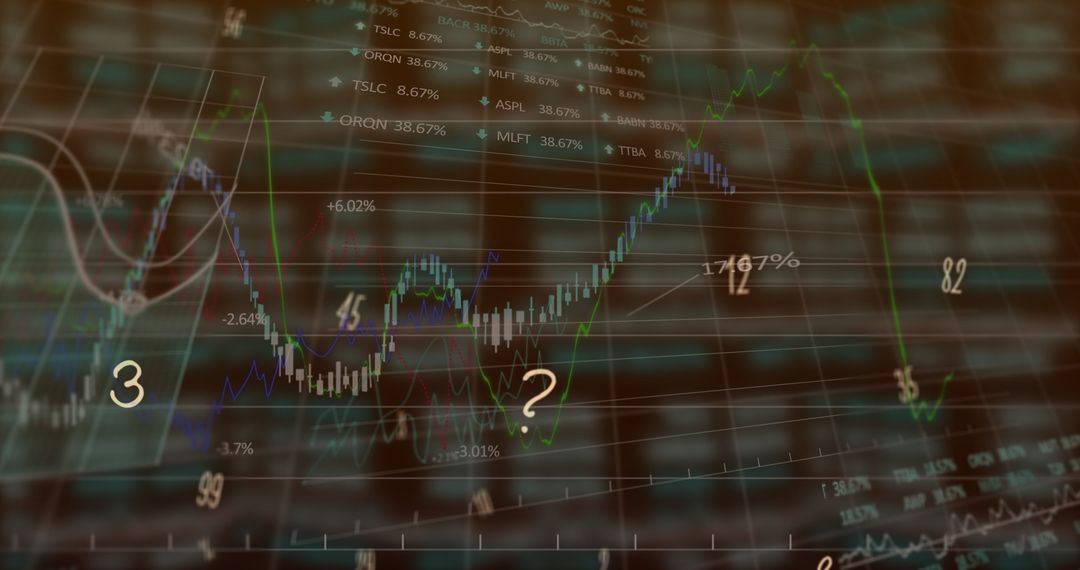
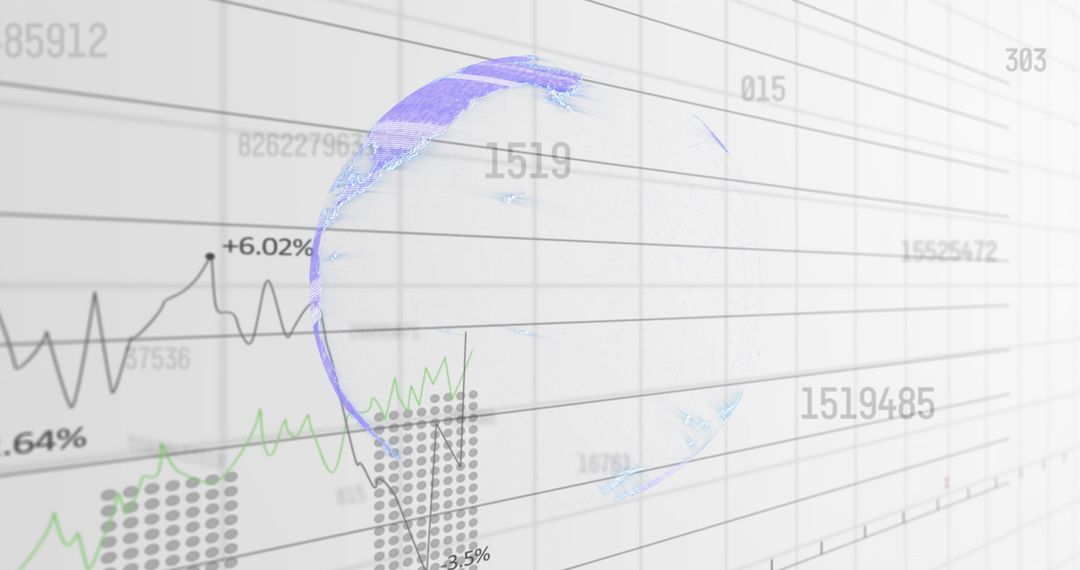
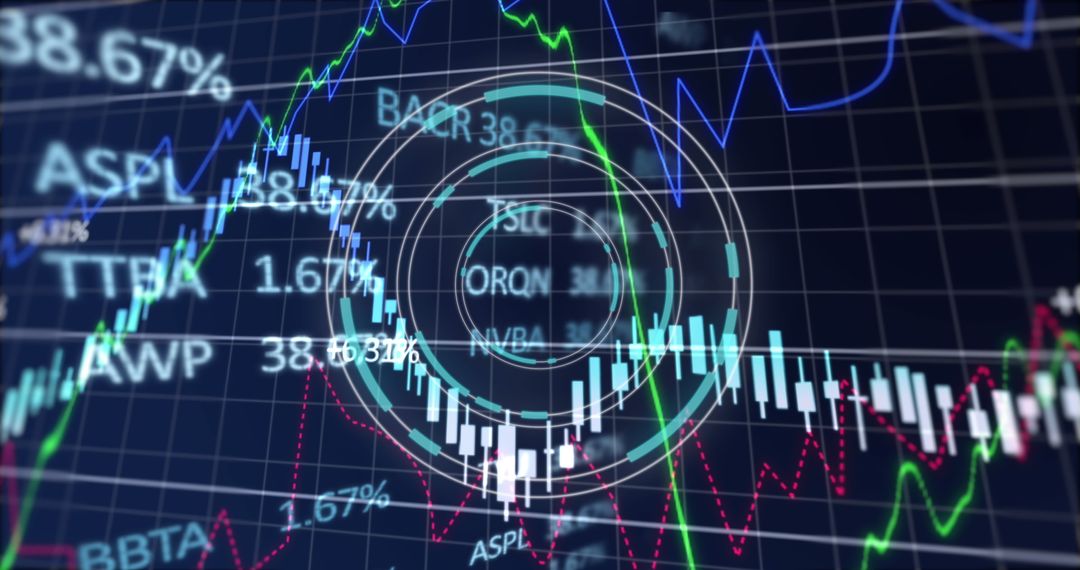
- Candlestick Market Dashboard with Wireframe Globe and Neural Network Data Visualization
Candlestick Market Dashboard with Wireframe Globe and Neural Network Data Visualization Image

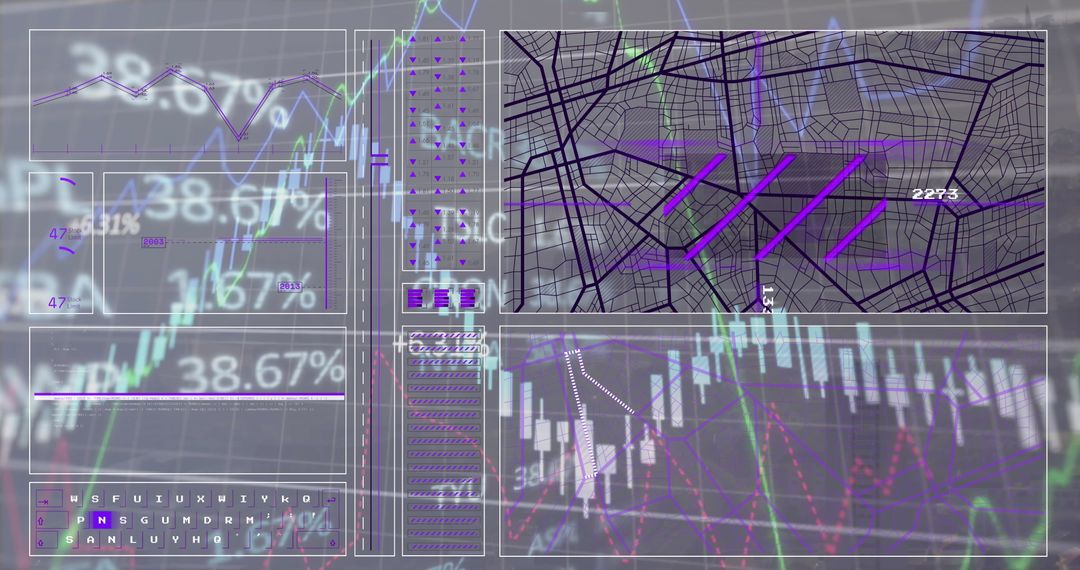
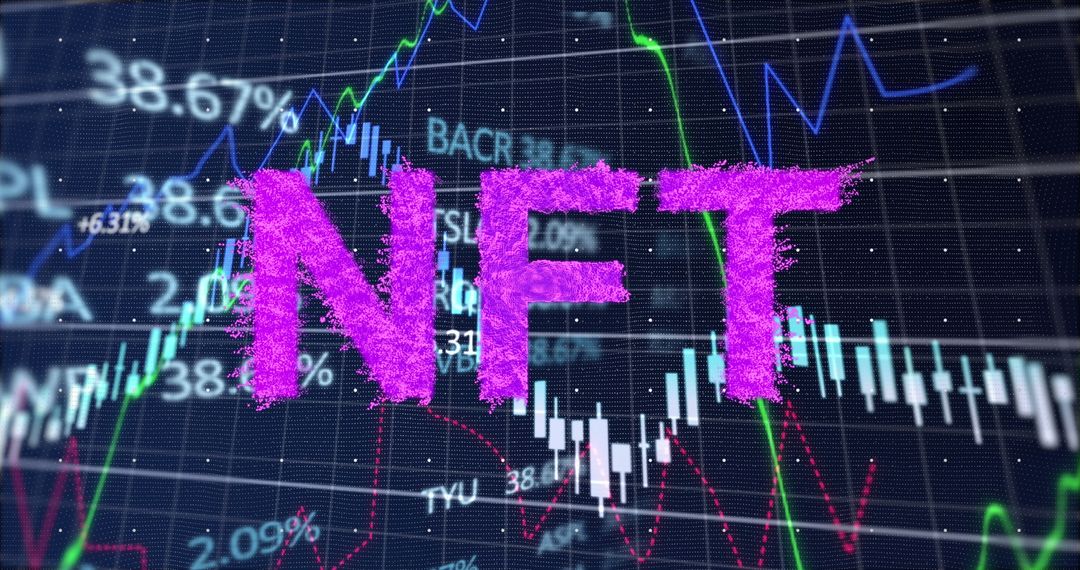
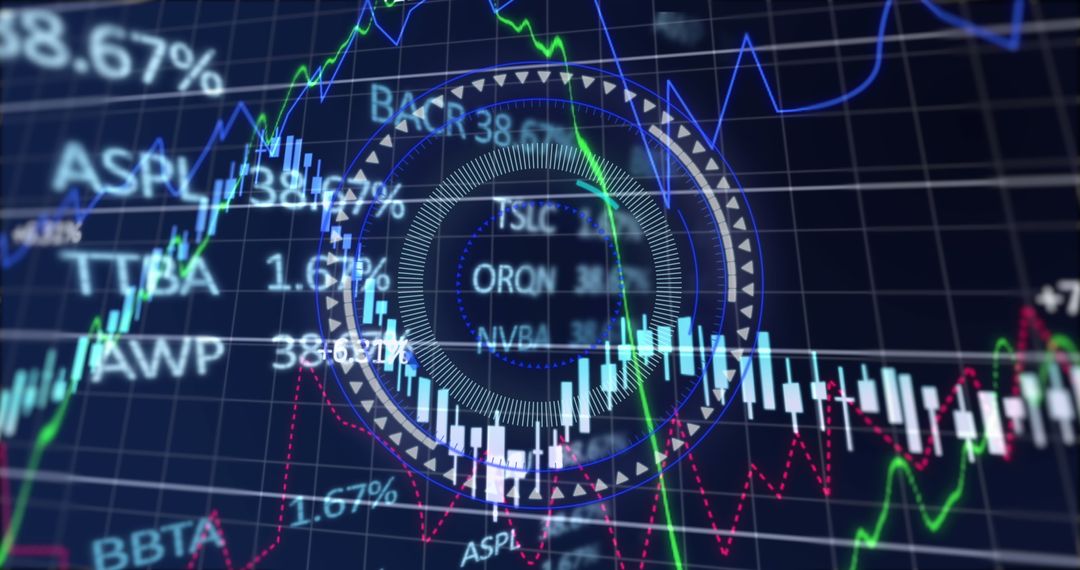
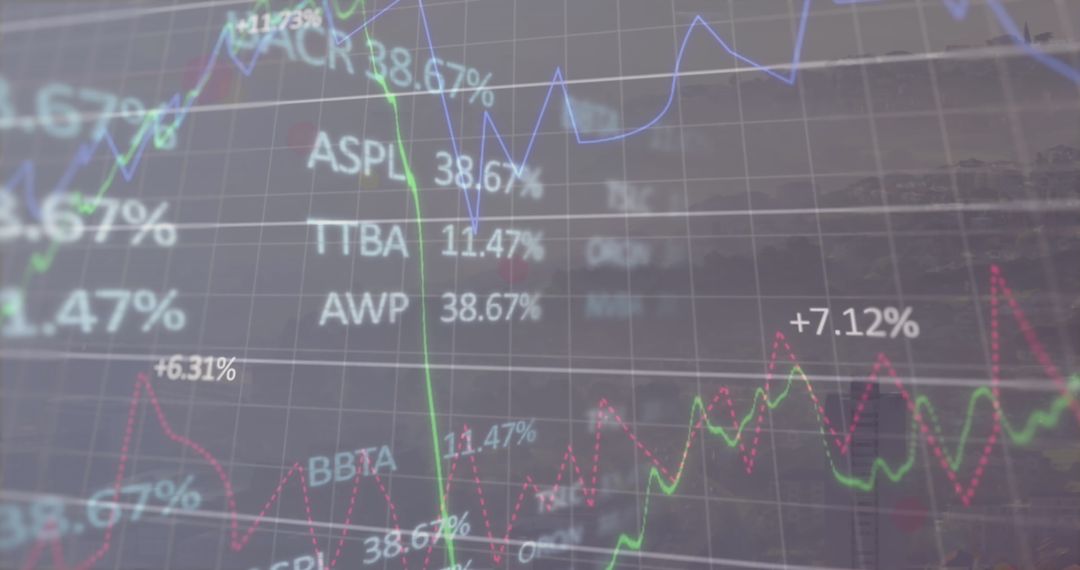
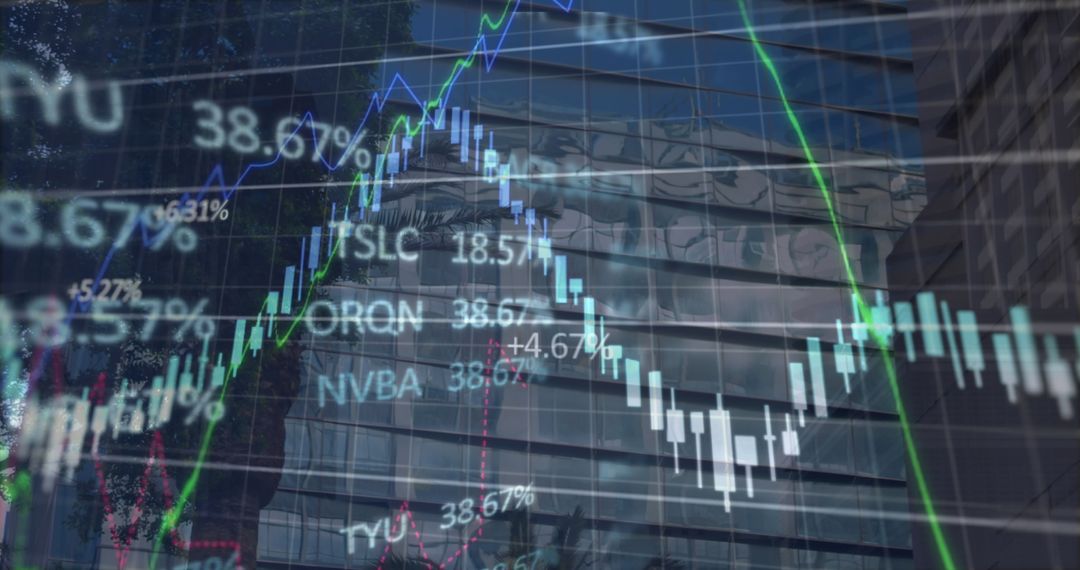
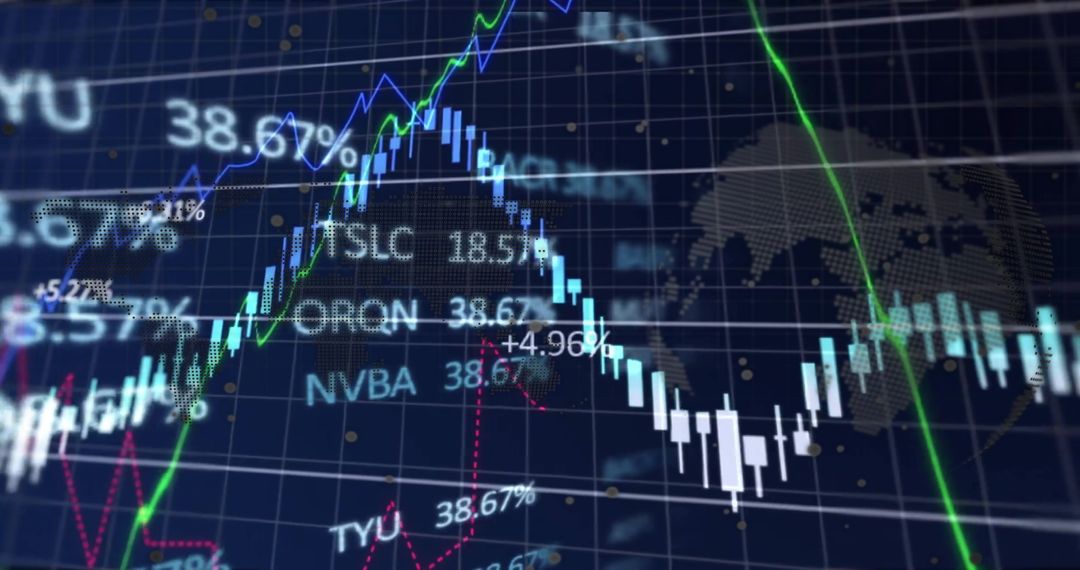
Showing central candlestick chart with overlaid line graphs, percentage labels, and stock tickers, conveying active market movement and real-time analytics. Combining wireframe globe and neural net nodes to imply global connectivity, algorithmic trading, and machine intelligence. Featuring dark blue grid background for high-tech corporate look and strong visual contrast. Suitable for fintech websites, trading platform interfaces, investor pitch decks, financial reports, market analysis articles, social media marketing, and editorial illustrations. Allow cropping for hero banners, using full-frame layout for presentation slides, or focusing on close-up sections for infographics and ad creatives. Recommend pairing with bold headlines, numeric callouts, and transparent overlays for clear data storytelling and user interface mockups.
Powered by 


0
downloads
downloads
Tags:
More
Credit Photo
If you would like to credit the Photo, here are some ways you can do so
Text Link
photo Link
<span class="text-link">
<span>
<a target="_blank" href=https://pikwizard.com/photo/candlestick-market-dashboard-with-wireframe-globe-and-neural-network-data-visualization/148c17a454ffce8005e30b9490e774b1/>PikWizard</a>
</span>
</span>
<span class="image-link">
<span
style="margin: 0 0 20px 0; display: inline-block; vertical-align: middle; width: 100%;"
>
<a
target="_blank"
href="https://pikwizard.com/photo/candlestick-market-dashboard-with-wireframe-globe-and-neural-network-data-visualization/148c17a454ffce8005e30b9490e774b1/"
style="text-decoration: none; font-size: 10px; margin: 0;"
>
<img src="https://pikwizard.com/pw/medium/148c17a454ffce8005e30b9490e774b1.jpg" style="margin: 0; width: 100%;" alt="" />
<p style="font-size: 12px; margin: 0;">PikWizard</p>
</a>
</span>
</span>
Free (free of charge)
Free for personal and commercial use.
Author: Awesome Content
Similar Free Stock Images

Premium


Premium


Premium


Premium


Premium


Premium


Premium


Premium


Premium


Premium


Premium


Premium


Premium


Premium


Premium


Premium


Premium


Premium


Premium


Premium


Premium


Premium


Premium


Premium