
- Home >
- Stock Photos >
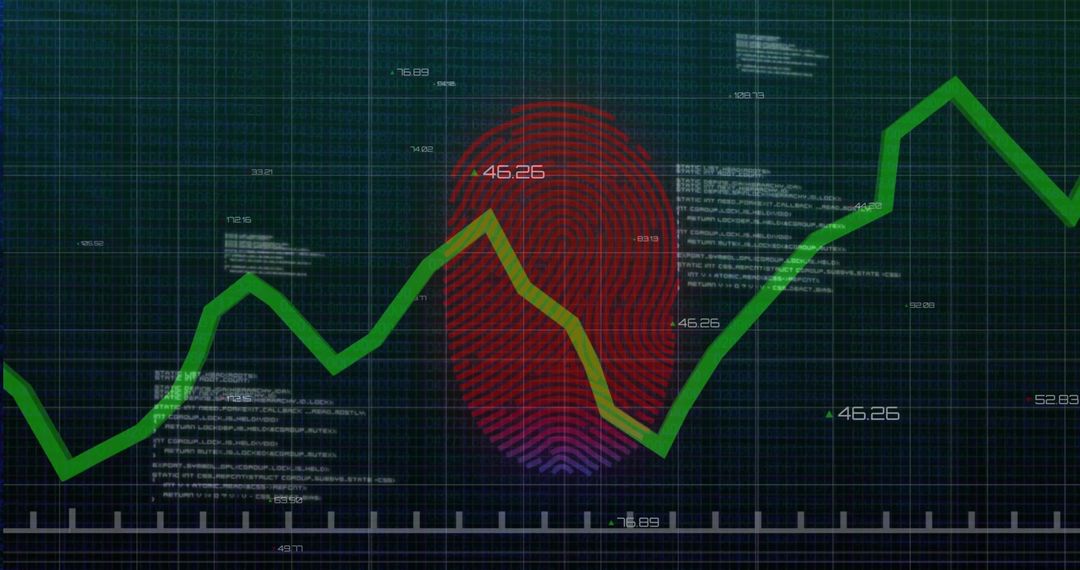
- Candlestick trading chart displaying trend lines, indicators and percentage labels
Candlestick trading chart displaying trend lines, indicators and percentage labels Image

Showing candlestick chart on navy grid background with white candles, green trend line, blue and red indicators, hexagon overlay and numeric percent labels. Displaying upward and downward price swings with annotated percent changes for context. Ideal for financial websites, trading platforms, market analysis articles, newsletter headers, presentation slides, social media posts, fintech apps and educational materials. Working well as hero banner, report cover, blog illustration or infographic element. Offering high contrast colors and clear data markers for visual emphasis and easy cropping for layouts.
Powered by  - Get 15% off with code: PIKWIZARD15


0
downloads
downloads
Tags:
More
Credit Photo
If you would like to credit the Photo, here are some ways you can do so
Text Link
photo Link
<span class="text-link">
<span>
<a target="_blank" href=https://pikwizard.com/photo/candlestick-trading-chart-displaying-trend-lines-indicators-and-percentage-labels/738f2ed86e772c740b14a77d76c01d97/>PikWizard</a>
</span>
</span>
<span class="image-link">
<span
style="margin: 0 0 20px 0; display: inline-block; vertical-align: middle; width: 100%;"
>
<a
target="_blank"
href="https://pikwizard.com/photo/candlestick-trading-chart-displaying-trend-lines-indicators-and-percentage-labels/738f2ed86e772c740b14a77d76c01d97/"
style="text-decoration: none; font-size: 10px; margin: 0;"
>
<img src="https://pikwizard.com/pw/medium/738f2ed86e772c740b14a77d76c01d97.jpg" style="margin: 0; width: 100%;" alt="" />
<p style="font-size: 12px; margin: 0;">PikWizard</p>
</a>
</span>
</span>
Free (free of charge)
Free for personal and commercial use.
Author: Authentic Images
Similar Free Stock Images

Premium


Premium


Premium


Premium


Premium


Premium


Premium


Premium


Premium


Premium


Premium


Premium


Premium


Premium


Premium


Premium


Premium


Premium


Premium


Premium


Premium


Premium


Premium


Premium

