- Home >
- Stock Photos >
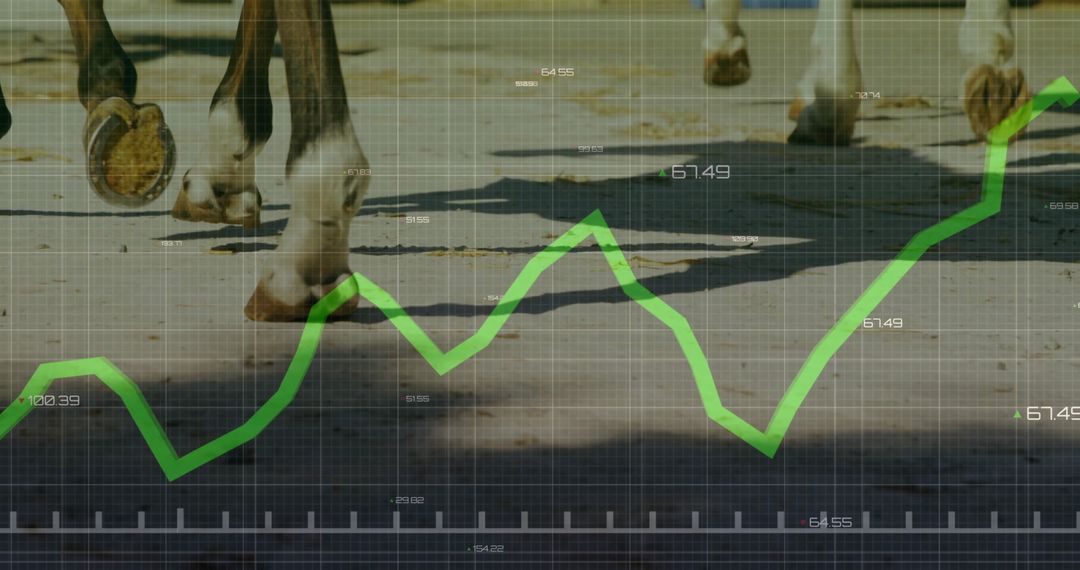
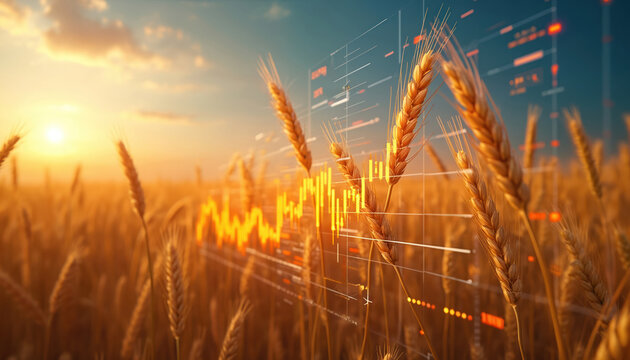
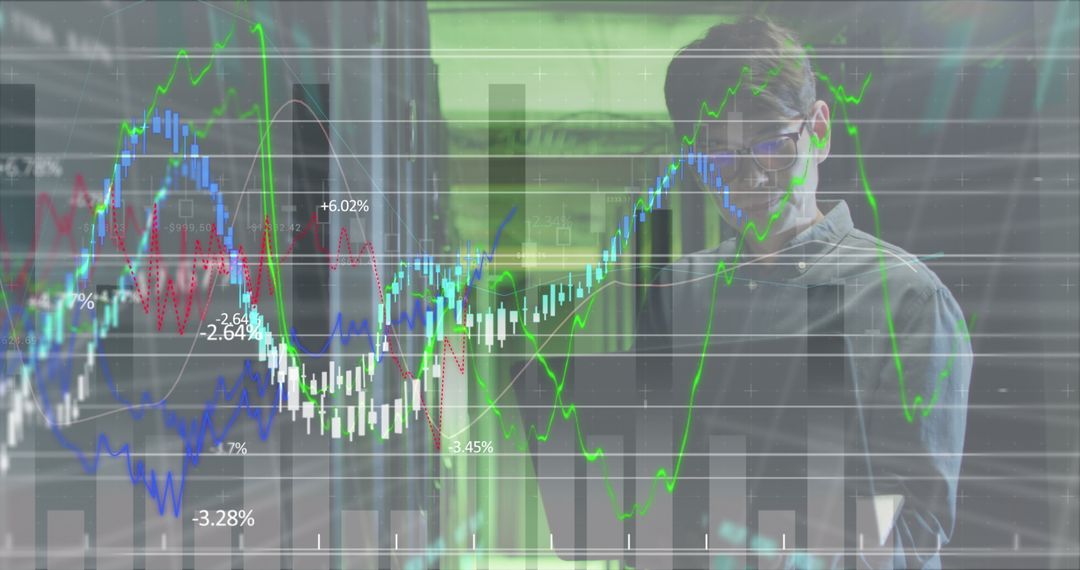
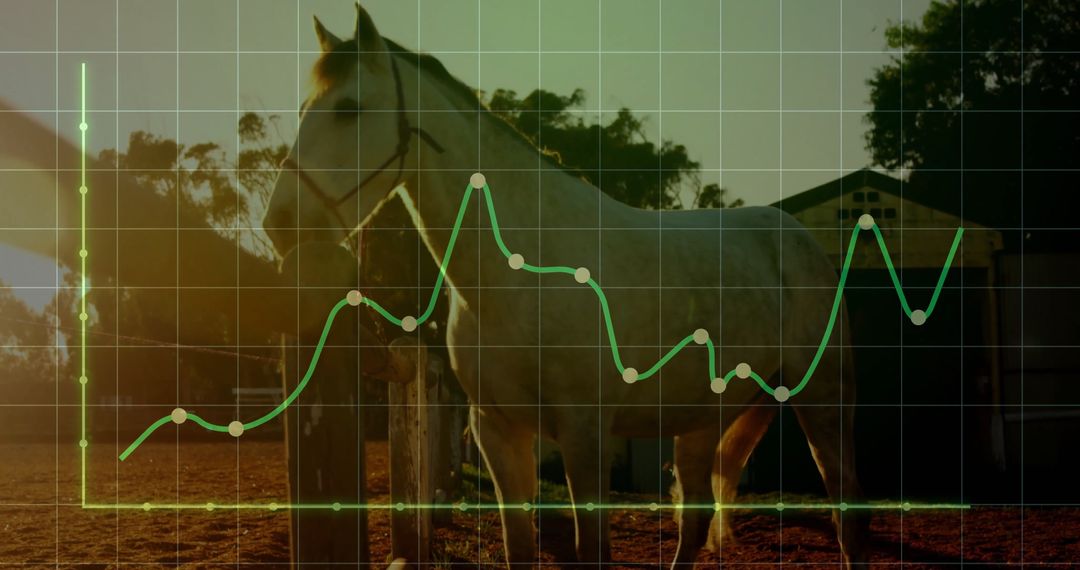
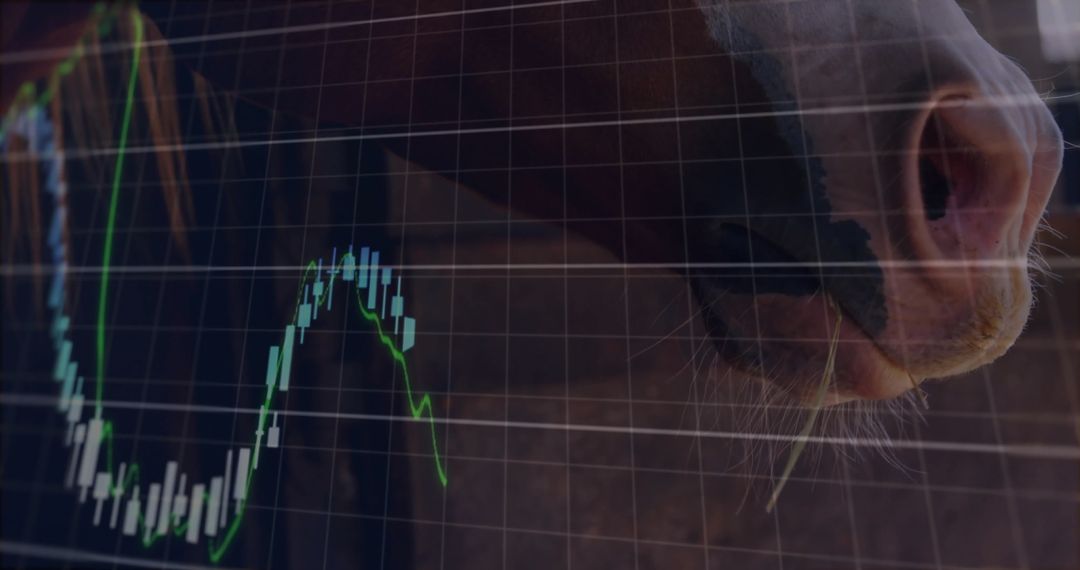
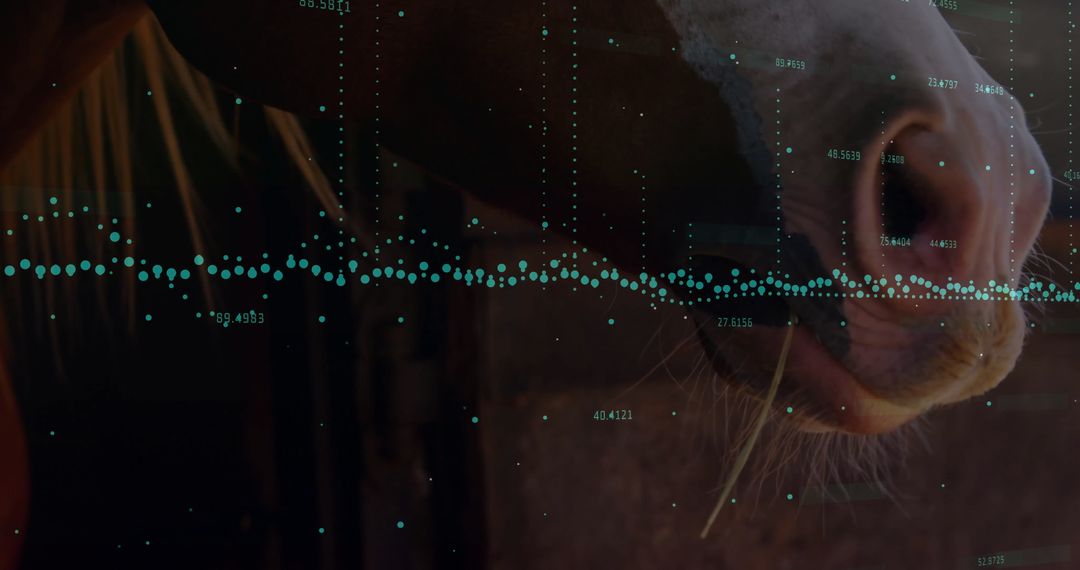
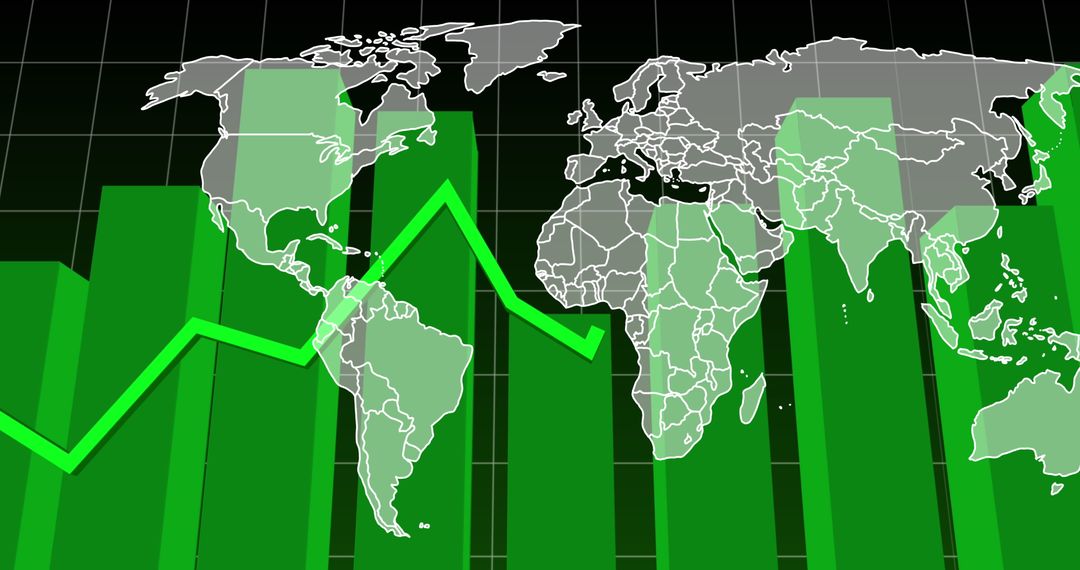
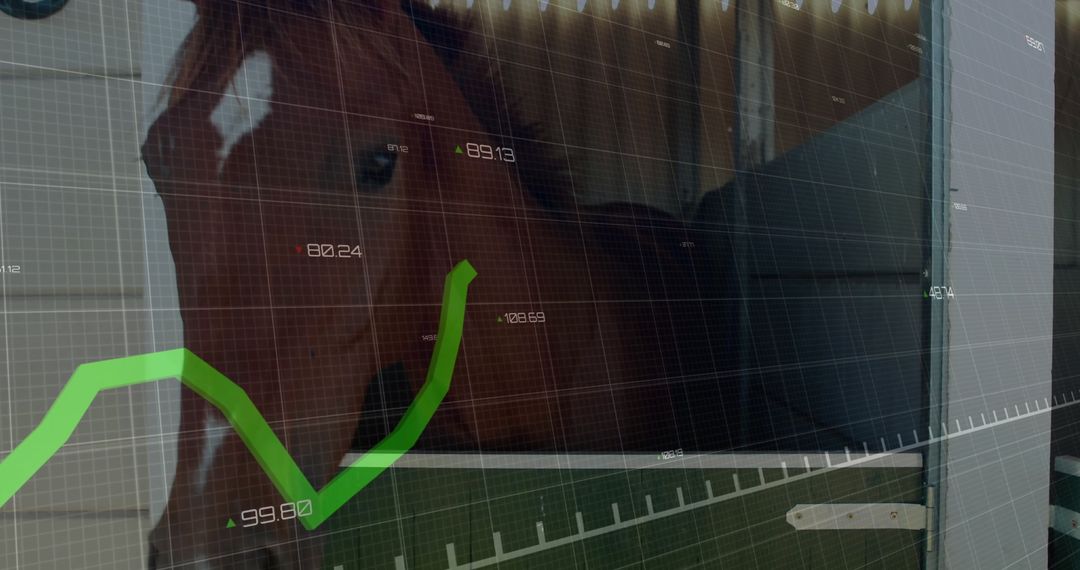
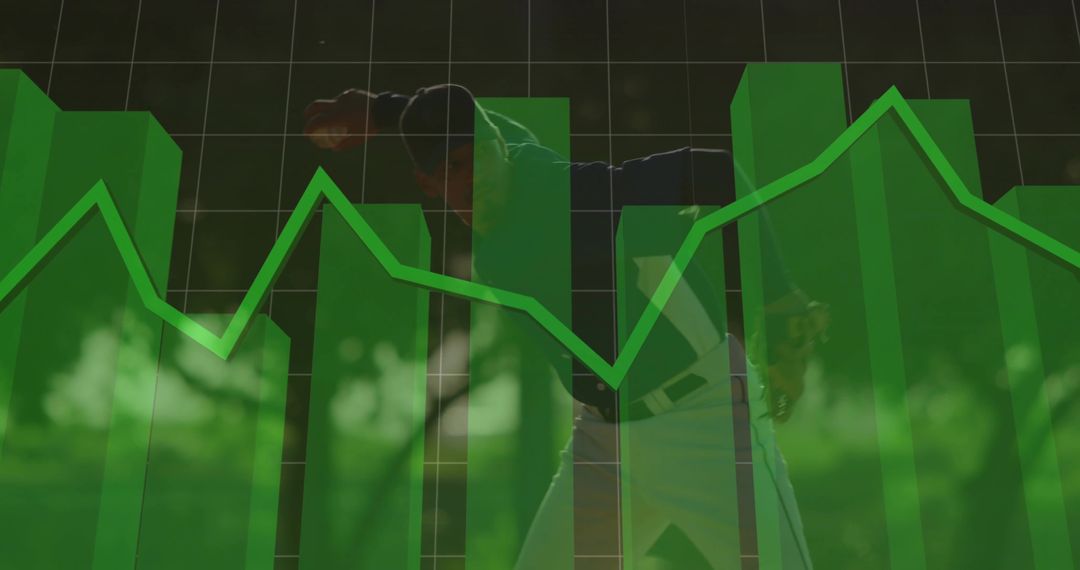
- Cattle Market Data Overlaying Green Bar Chart and Line Graph for Agribusiness Trends
Cattle Market Data Overlaying Green Bar Chart and Line Graph for Agribusiness Trends Image
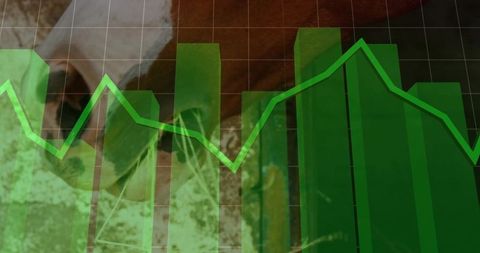
Showing cattle portrait merged with translucent green bar chart and jagged line graph, conveying commodity price fluctuations and farm finance performance. Useful for illustrating agribusiness reports, commodity market analysis, sustainability and investment presentations, agriculture news, financial websites, annual reports, infographics and editorial layouts. Working well as background for headlines, banners, slide decks, social media posts and marketing materials. Offering strong visual metaphor for cattle pricing, supply chain analytics, rural economy trends and ESG agriculture initiatives.
Powered by 

0
downloads
downloads
Tags:
More
Credit Photo
If you would like to credit the Photo, here are some ways you can do so
Text Link
photo Link
<span class="text-link">
<span>
<a target="_blank" href=https://pikwizard.com/photo/cattle-market-data-overlaying-green-bar-chart-and-line-graph-for-agribusiness-trends/84d214098142e93450125e0df680c0b5/>PikWizard</a>
</span>
</span>
<span class="image-link">
<span
style="margin: 0 0 20px 0; display: inline-block; vertical-align: middle; width: 100%;"
>
<a
target="_blank"
href="https://pikwizard.com/photo/cattle-market-data-overlaying-green-bar-chart-and-line-graph-for-agribusiness-trends/84d214098142e93450125e0df680c0b5/"
style="text-decoration: none; font-size: 10px; margin: 0;"
>
<img src="https://pikwizard.com/pw/medium/84d214098142e93450125e0df680c0b5.jpg" style="margin: 0; width: 100%;" alt="" />
<p style="font-size: 12px; margin: 0;">PikWizard</p>
</a>
</span>
</span>
Free (free of charge)
Free for personal and commercial use.
Author: Awesome Content
Similar Free Stock Images

Premium


Premium


Premium


Premium


Premium


Premium


Premium


Premium


Premium


Premium


Premium

Premium


Premium


Premium


Premium


Premium


Premium


Premium


Premium


Premium


Premium


Premium


Premium


Premium