- Home >
- Stock Photos >
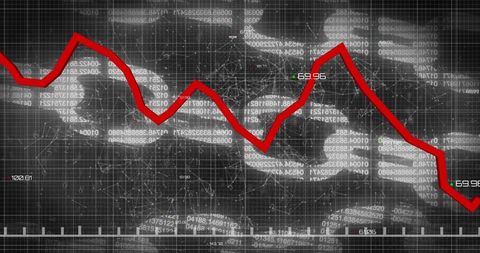
- Chained Dollar Sign on Downward Economic Graph
Chained Dollar Sign on Downward Economic Graph Image
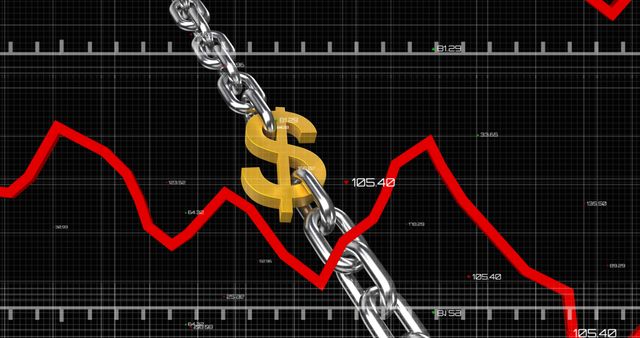
Graph illustrating sharp decline in economic performance. Chain and dollar sign symbolize associated downturn, inflation and financial loss. Ideal content for discussions and publications regarding fiscal crises and economic instability.
Powered by  - Get 15% off with code: PIKWIZARD15


41
downloads
downloads
Tags:
More
Credit Photo
If you would like to credit the Photo, here are some ways you can do so
Text Link
photo Link
<span class="text-link">
<span>
<a target="_blank" href=https://pikwizard.com/photo/chained-dollar-sign-on-downward-economic-graph/cef80281b76bf7b0ef7ba442d35a161b/>PikWizard</a>
</span>
</span>
<span class="image-link">
<span
style="margin: 0 0 20px 0; display: inline-block; vertical-align: middle; width: 100%;"
>
<a
target="_blank"
href="https://pikwizard.com/photo/chained-dollar-sign-on-downward-economic-graph/cef80281b76bf7b0ef7ba442d35a161b/"
style="text-decoration: none; font-size: 10px; margin: 0;"
>
<img src="https://pikwizard.com/pw/medium/cef80281b76bf7b0ef7ba442d35a161b.jpg" style="margin: 0; width: 100%;" alt="" />
<p style="font-size: 12px; margin: 0;">PikWizard</p>
</a>
</span>
</span>
Free (free of charge)
Free for personal and commercial use.
Author: Creative Art
Similar Free Stock Images

Premium


Premium


Premium


Premium


Premium


Premium


Premium


Premium


Premium


Premium


Premium


Premium


Premium


Premium


Premium


Premium


Premium


Premium


Premium


Premium


Premium


Premium


Premium


Premium


Premium