
- Home >
- Stock Photos >
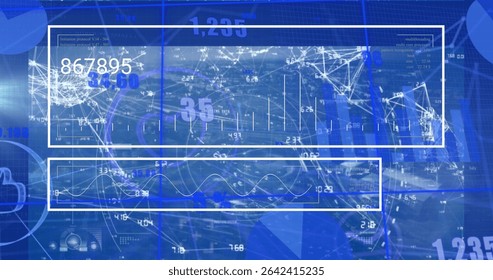
- Changing Numbers on Computer Interface with Graph Lines
Changing Numbers on Computer Interface with Graph Lines Image

This image shows a graphic representation of changing numbers intertwined with graph lines on a digital display against a blue background. It symbolizes technology and business analytics, making it suitable for illustrating stories or articles about data visualization, digital technology, data analysis, and modern business tools. It can be used in presentations, reports, or blogs that discuss trends in business analytics and IT functionalities.
Powered by  - Get 15% off with code: PIKWIZARD15


downloads
Tags:
More
Credit Photo
If you would like to credit the Photo, here are some ways you can do so
Text Link
photo Link
<span class="text-link">
<span>
<a target="_blank" href=https://pikwizard.com/photo/changing-numbers-on-computer-interface-with-graph-lines/cbda984a4ad774192778a48d703eda92/>PikWizard</a>
</span>
</span>
<span class="image-link">
<span
style="margin: 0 0 20px 0; display: inline-block; vertical-align: middle; width: 100%;"
>
<a
target="_blank"
href="https://pikwizard.com/photo/changing-numbers-on-computer-interface-with-graph-lines/cbda984a4ad774192778a48d703eda92/"
style="text-decoration: none; font-size: 10px; margin: 0;"
>
<img src="https://pikwizard.com/pw/medium/cbda984a4ad774192778a48d703eda92.jpg" style="margin: 0; width: 100%;" alt="" />
<p style="font-size: 12px; margin: 0;">PikWizard</p>
</a>
</span>
</span>
Free (free of charge)
Free for personal and commercial use.
Author: Creative Art
Similar Free Stock Images

Premium


Premium


Premium

Premium


Premium


Premium


Premium


Premium


Premium


Premium


Premium

Premium

Premium


Premium

Premium


Premium


Premium


Premium


Premium


Premium


Premium

Premium


Premium


Premium


Premium


Explore More Free Stock Images