- Home >
- Stock Photos >
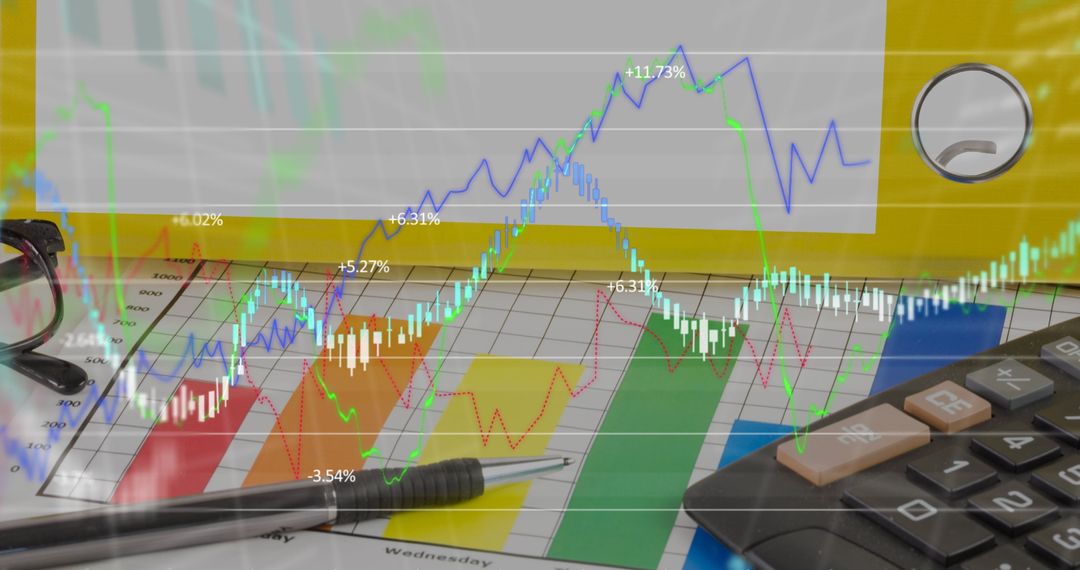
- Charts and Calculator Overlapping Financial Documents Concept
Charts and Calculator Overlapping Financial Documents Concept Image
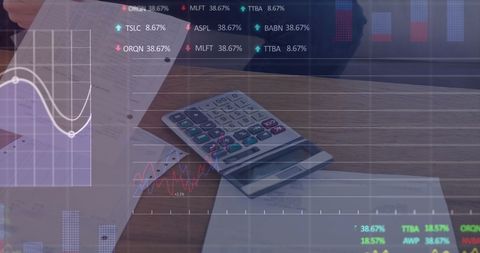
Features digital charts overlaying printed financial documents, with a calculator on a desk. Suitable for use in finance-related articles, presentations about economic analysis, or resources on budgeting and investment strategies.
Powered by  - Get 15% off with code: PIKWIZARD15


4
downloads
downloads
Tags:
More
Credit Photo
If you would like to credit the Photo, here are some ways you can do so
Text Link
photo Link
<span class="text-link">
<span>
<a target="_blank" href=https://pikwizard.com/photo/charts-and-calculator-overlapping-financial-documents-concept/4b75d77d02e1d8360d0c486569eff849/>PikWizard</a>
</span>
</span>
<span class="image-link">
<span
style="margin: 0 0 20px 0; display: inline-block; vertical-align: middle; width: 100%;"
>
<a
target="_blank"
href="https://pikwizard.com/photo/charts-and-calculator-overlapping-financial-documents-concept/4b75d77d02e1d8360d0c486569eff849/"
style="text-decoration: none; font-size: 10px; margin: 0;"
>
<img src="https://pikwizard.com/pw/medium/4b75d77d02e1d8360d0c486569eff849.jpg" style="margin: 0; width: 100%;" alt="" />
<p style="font-size: 12px; margin: 0;">PikWizard</p>
</a>
</span>
</span>
Free (free of charge)
Free for personal and commercial use.
Author: Authentic Images
Similar Free Stock Images
Premium


Premium


Premium


Premium


Premium


Premium


Premium


Premium


Premium


Premium


Premium


Premium


Premium


Premium


Premium


Premium


Premium


Premium


Premium


Premium


Premium


Premium


Premium


Premium