- Home >
- Stock Photos >
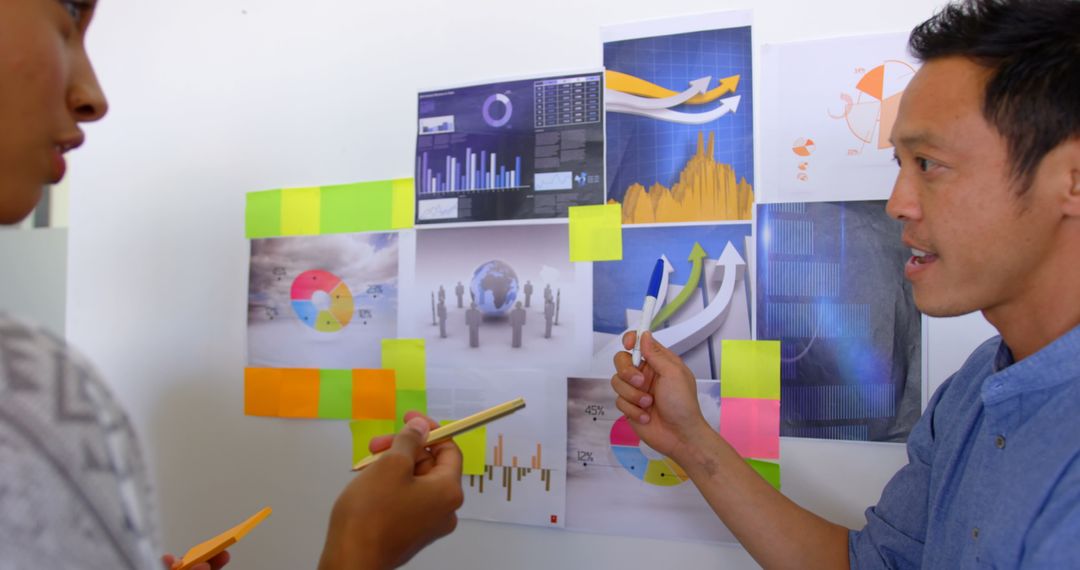
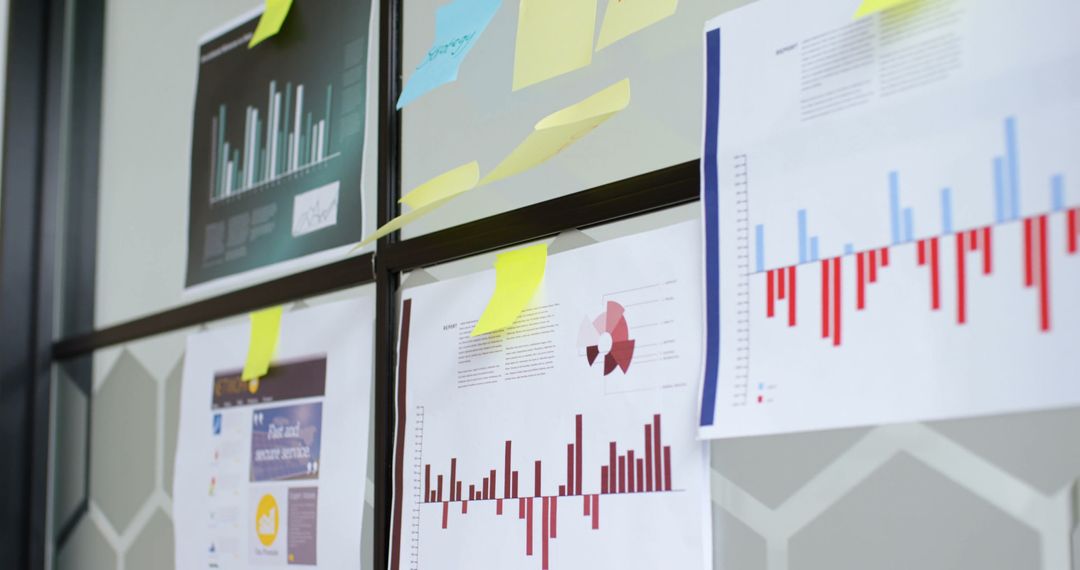
- Charts and Graphs Displayed in Office Brainstorming Session
Charts and Graphs Displayed in Office Brainstorming Session Image
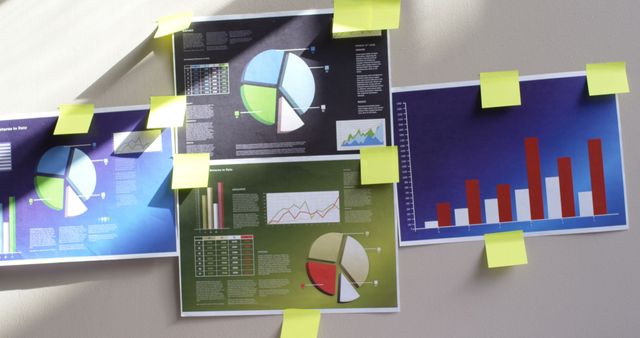
Visual representation of charts and graphs pinned to a wall, reflecting a collaborative office environment. Ideal for illustrating business concepts, project planning scenarios, or highlighting brainstorming sessions. Useful in presentations and marketing materials focused on data analysis and teamwork.
Powered by 


3
downloads
downloads
Tags:
More
Credit Photo
If you would like to credit the Photo, here are some ways you can do so
Text Link
photo Link
<span class="text-link">
<span>
<a target="_blank" href=https://pikwizard.com/photo/charts-and-graphs-displayed-in-office-brainstorming-session/0fa88feb9e13c7c30c7132a5172b72af/>PikWizard</a>
</span>
</span>
<span class="image-link">
<span
style="margin: 0 0 20px 0; display: inline-block; vertical-align: middle; width: 100%;"
>
<a
target="_blank"
href="https://pikwizard.com/photo/charts-and-graphs-displayed-in-office-brainstorming-session/0fa88feb9e13c7c30c7132a5172b72af/"
style="text-decoration: none; font-size: 10px; margin: 0;"
>
<img src="https://pikwizard.com/pw/medium/0fa88feb9e13c7c30c7132a5172b72af.jpg" style="margin: 0; width: 100%;" alt="" />
<p style="font-size: 12px; margin: 0;">PikWizard</p>
</a>
</span>
</span>
Free (free of charge)
Free for personal and commercial use.
Author: Awesome Content
Similar Free Stock Images
Premium


Premium


Premium


Premium


Premium


Premium


Premium


Premium


Premium


Premium


Premium


Premium


Premium


Premium


Premium


Premium


Premium


Premium


Premium


Premium


Premium


Premium


Premium


Premium