- Home >
- Stock Photos >
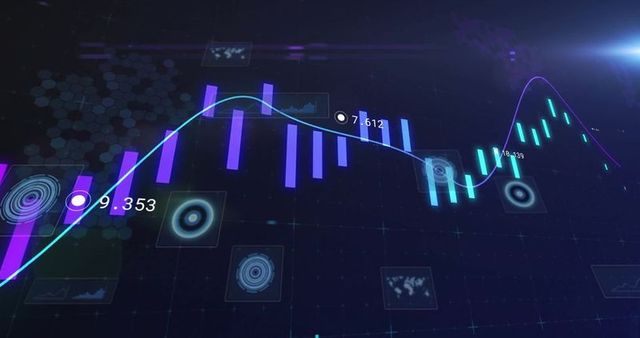
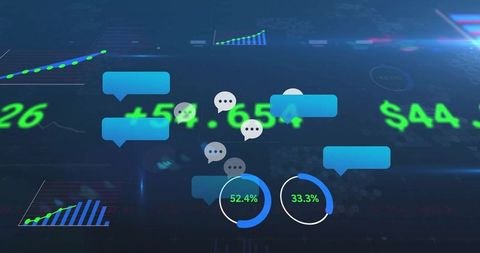
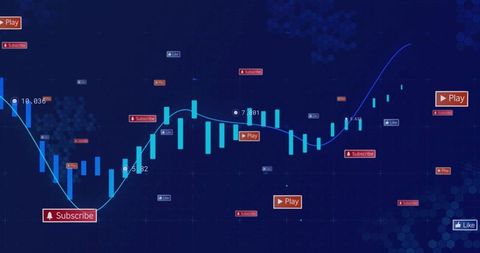
- Chat Bubbles and Digital Graphs on Financial Dashboard Interface
Chat Bubbles and Digital Graphs on Financial Dashboard Interface Image
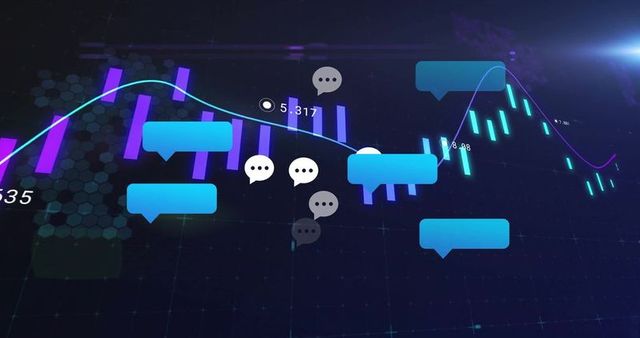
Data visualization features financial metrics alongside chat bubbles depicting digital discussions. It captures technology usage in market analysis and economic topics. Useful for webinars, presentations on financial tech innovation, podcasts discussing market strategies, or developing fintech software interfaces where interpreting complex data is pivotal.

downloads
Tags:
More
Credit Photo
If you would like to credit the Photo, here are some ways you can do so
Text Link
photo Link
<span class="text-link">
<span>
<a target="_blank" href=https://pikwizard.com/photo/chat-bubbles-and-digital-graphs-on-financial-dashboard-interface/489e2a7d95c946b5a9a2cf088768db24/>PikWizard</a>
</span>
</span>
<span class="image-link">
<span
style="margin: 0 0 20px 0; display: inline-block; vertical-align: middle; width: 100%;"
>
<a
target="_blank"
href="https://pikwizard.com/photo/chat-bubbles-and-digital-graphs-on-financial-dashboard-interface/489e2a7d95c946b5a9a2cf088768db24/"
style="text-decoration: none; font-size: 10px; margin: 0;"
>
<img src="https://pikwizard.com/pw/medium/489e2a7d95c946b5a9a2cf088768db24.jpg" style="margin: 0; width: 100%;" alt="" />
<p style="font-size: 12px; margin: 0;">PikWizard</p>
</a>
</span>
</span>
Free (free of charge)
Free for personal and commercial use.
Author: Awesome Content