
- Home >
- Stock Photos >
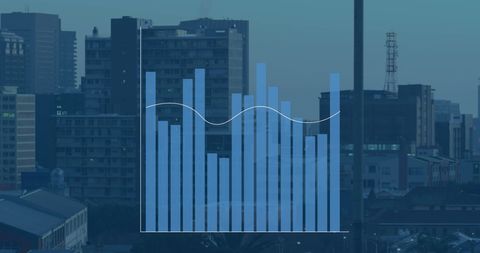
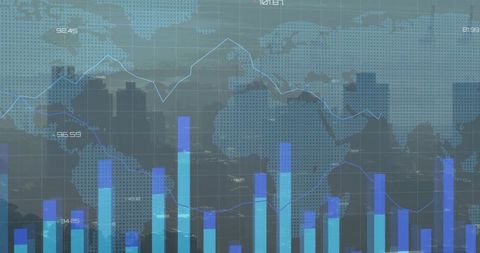
- City Horizons Blending with Digital Data Analytics Visualization
City Horizons Blending with Digital Data Analytics Visualization Image

Glowing digital graphs and data overlays merge with a nighttime cityscape, representing modern business intelligence and urban technology integration. Useful for illustrating the concepts of data analytics, urban infrastructure networking, and the impact of digital interfaces in contemporary settings. Ideal for presentations, reports, and marketing materials in technology-driven industries focused on data and communication services.
Powered by  - Get 15% off with code: PIKWIZARD15


downloads
Tags:
More
Credit Photo
If you would like to credit the Photo, here are some ways you can do so
Text Link
photo Link
<span class="text-link">
<span>
<a target="_blank" href=https://pikwizard.com/photo/city-horizons-blending-with-digital-data-analytics-visualization/adbe53f0c16958312c79d93cded754ac/>PikWizard</a>
</span>
</span>
<span class="image-link">
<span
style="margin: 0 0 20px 0; display: inline-block; vertical-align: middle; width: 100%;"
>
<a
target="_blank"
href="https://pikwizard.com/photo/city-horizons-blending-with-digital-data-analytics-visualization/adbe53f0c16958312c79d93cded754ac/"
style="text-decoration: none; font-size: 10px; margin: 0;"
>
<img src="https://pikwizard.com/pw/medium/adbe53f0c16958312c79d93cded754ac.jpg" style="margin: 0; width: 100%;" alt="" />
<p style="font-size: 12px; margin: 0;">PikWizard</p>
</a>
</span>
</span>
Free (free of charge)
Free for personal and commercial use.
Author: Authentic Images
Similar Free Stock Images

Premium


Premium


Premium


Premium


Premium


Premium


Premium


Premium


Premium


Premium


Premium


Premium


Premium


Premium


Premium


Premium


Premium


Premium


Premium


Premium

Premium


Premium

Premium


Premium


Premium


Explore More Free Stock Images