- Home >
- Stock Photos >
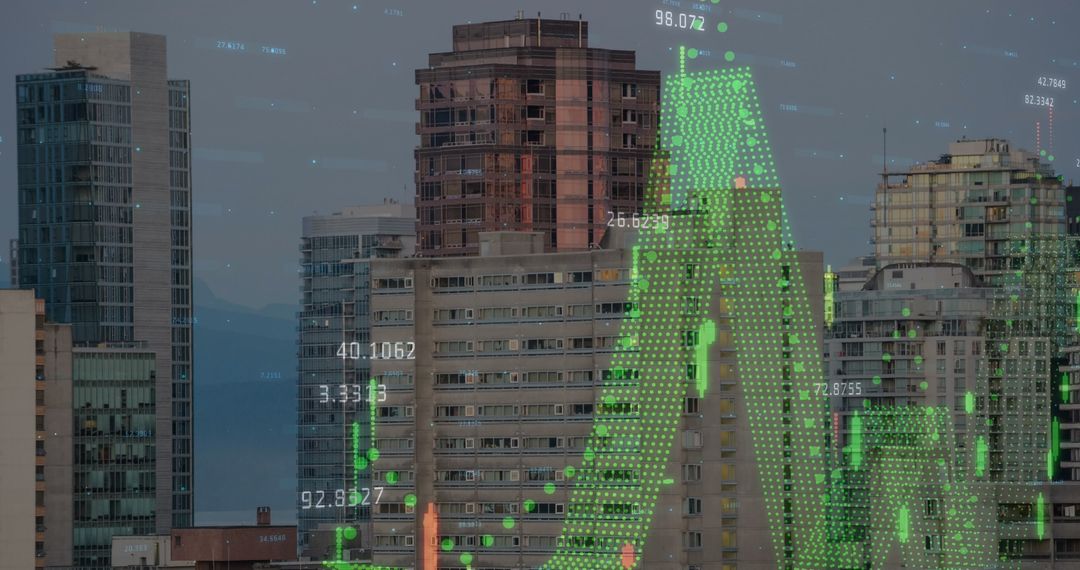
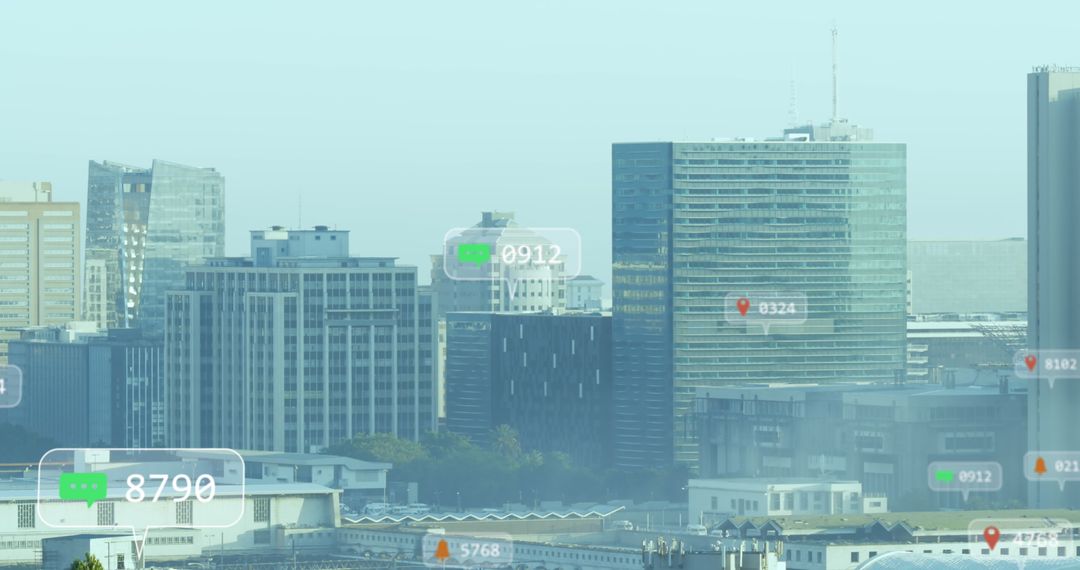
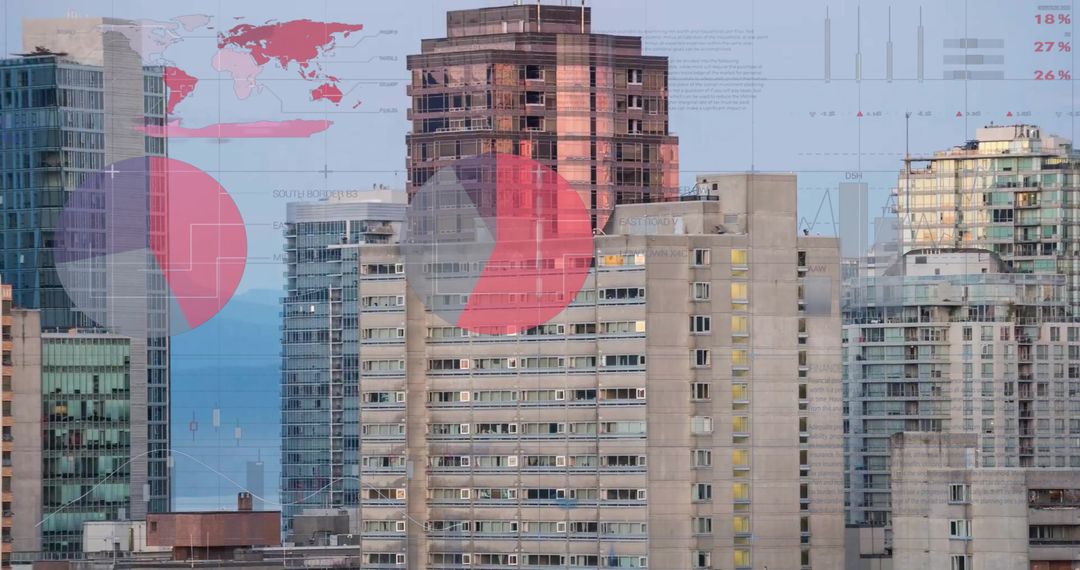
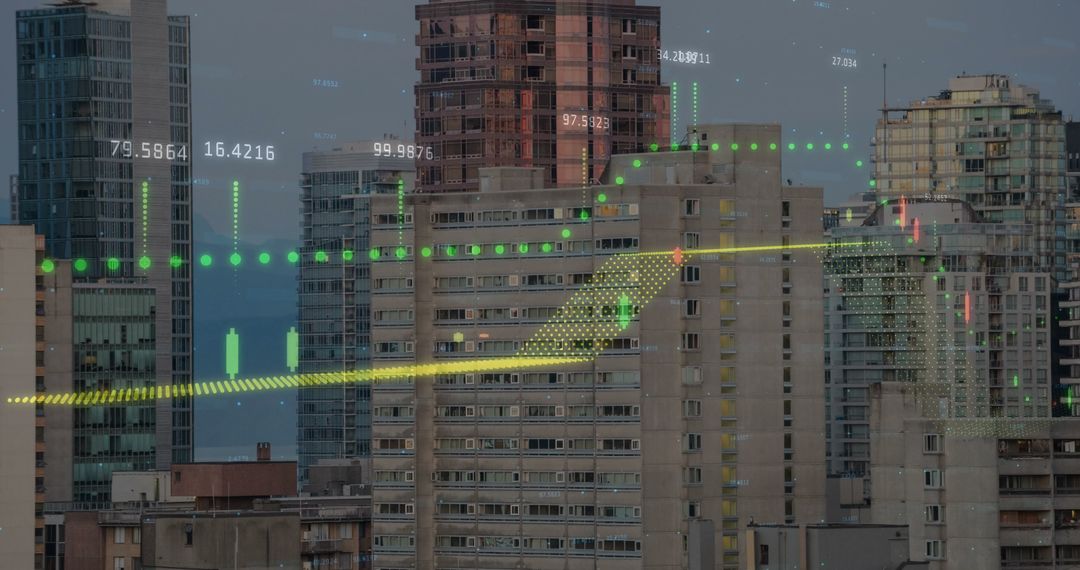
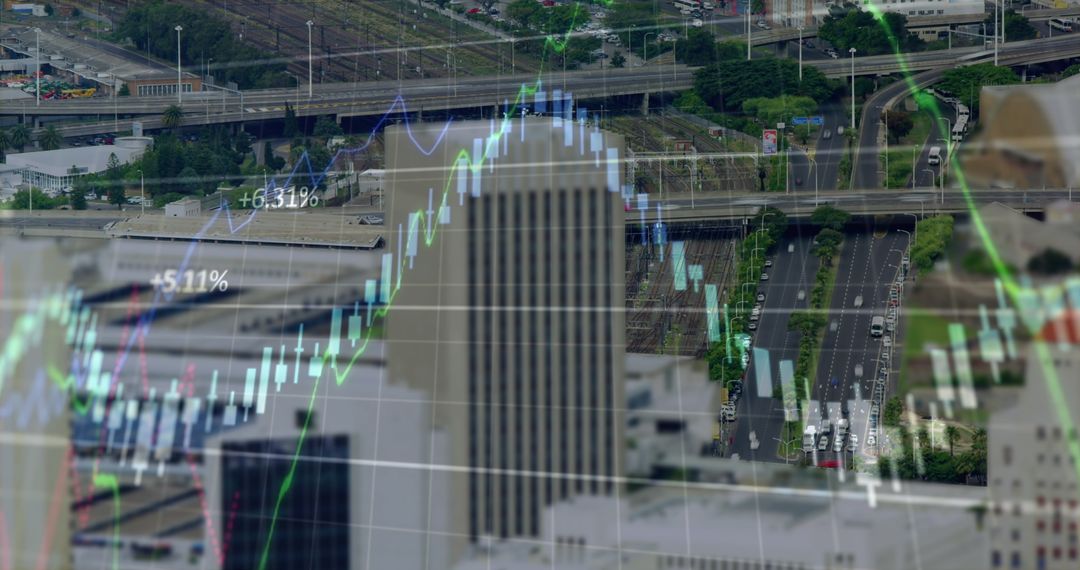
- City Skyline Blended with Financial Data Graphs
City Skyline Blended with Financial Data Graphs Image

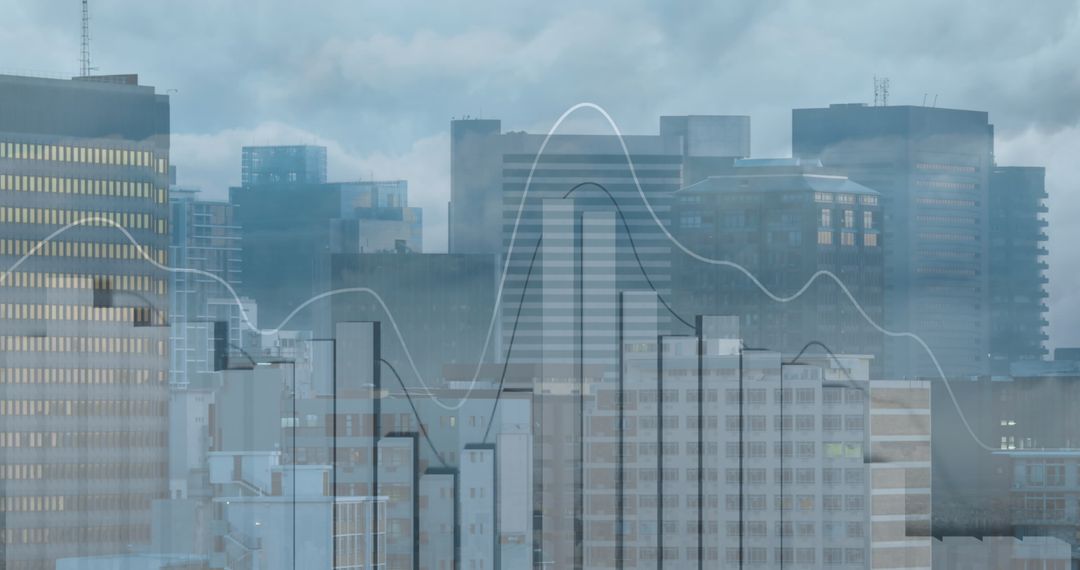
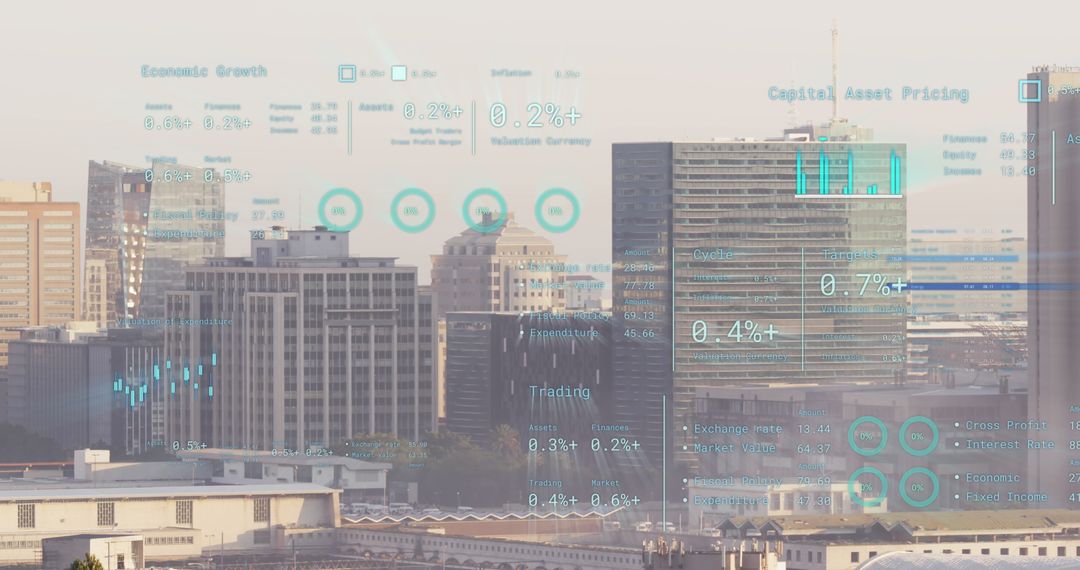
City skyline with overlaid financial graphs summarizes the blend of urban life and financial analytics. Can illustrate topics like global markets, financial health, or economic trends impacting metropolitan areas. Useful for publications on finance technology, stock market trading analysis, or global economic studies.
Powered by  - Get 15% off with code: PIKWIZARD15


6
downloads
downloads
Tags:
More
Credit Photo
If you would like to credit the Photo, here are some ways you can do so
Text Link
photo Link
<span class="text-link">
<span>
<a target="_blank" href=https://pikwizard.com/photo/city-skyline-blended-with-financial-data-graphs/4dd569b6feb1c7ba6c520a0d034b57cf/>PikWizard</a>
</span>
</span>
<span class="image-link">
<span
style="margin: 0 0 20px 0; display: inline-block; vertical-align: middle; width: 100%;"
>
<a
target="_blank"
href="https://pikwizard.com/photo/city-skyline-blended-with-financial-data-graphs/4dd569b6feb1c7ba6c520a0d034b57cf/"
style="text-decoration: none; font-size: 10px; margin: 0;"
>
<img src="https://pikwizard.com/pw/medium/4dd569b6feb1c7ba6c520a0d034b57cf.jpg" style="margin: 0; width: 100%;" alt="" />
<p style="font-size: 12px; margin: 0;">PikWizard</p>
</a>
</span>
</span>
Free (free of charge)
Free for personal and commercial use.
Author: People Creations
Similar Free Stock Images

Premium


Premium


Premium


Premium


Premium


Premium


Premium


Premium


Premium


Premium


Premium


Premium


Premium


Premium


Premium


Premium


Premium


Premium


Premium


Premium


Premium


Premium


Premium


Premium