
- Home >
- Stock Photos >
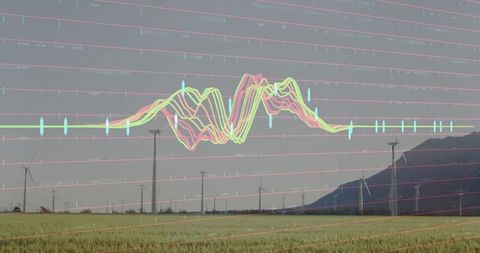
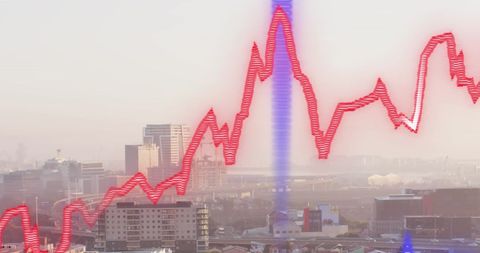
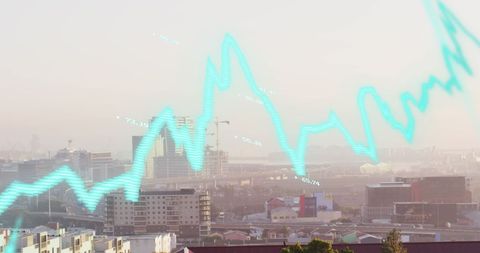
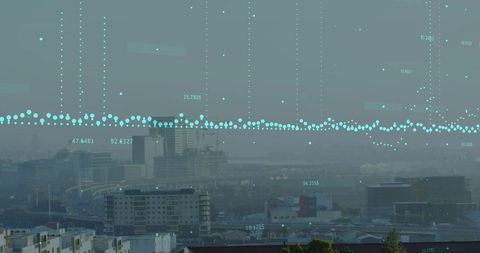
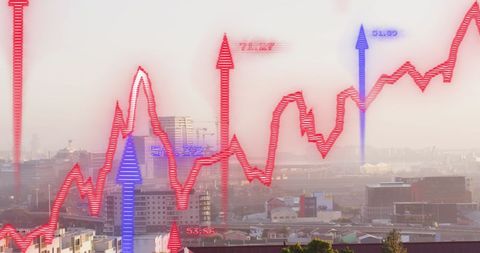
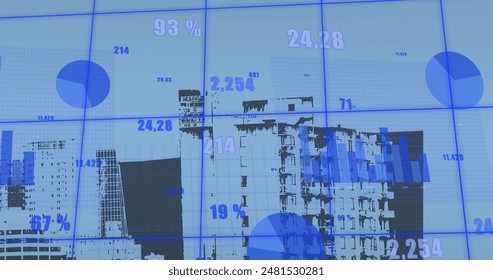
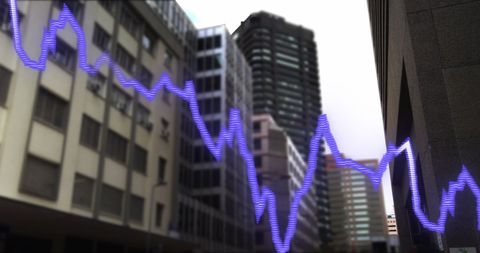
- Cityscape with Digital Graphs Overlaid Representing Data Analysis
Cityscape with Digital Graphs Overlaid Representing Data Analysis Image

Visual representation of business analytics and urban infrastructure. Suitable for use in presentations or reports related to financial markets, data trends, or technological advancements in urban planning.
Powered by  - Get 15% off with code: PIKWIZARD15


downloads
Tags:
More
Credit Photo
If you would like to credit the Photo, here are some ways you can do so
Text Link
photo Link
<span class="text-link">
<span>
<a target="_blank" href=https://pikwizard.com/photo/cityscape-with-digital-graphs-overlaid-representing-data-analysis/89d235e769db12544fc939d6bf48a047/>PikWizard</a>
</span>
</span>
<span class="image-link">
<span
style="margin: 0 0 20px 0; display: inline-block; vertical-align: middle; width: 100%;"
>
<a
target="_blank"
href="https://pikwizard.com/photo/cityscape-with-digital-graphs-overlaid-representing-data-analysis/89d235e769db12544fc939d6bf48a047/"
style="text-decoration: none; font-size: 10px; margin: 0;"
>
<img src="https://pikwizard.com/pw/medium/89d235e769db12544fc939d6bf48a047.jpg" style="margin: 0; width: 100%;" alt="" />
<p style="font-size: 12px; margin: 0;">PikWizard</p>
</a>
</span>
</span>
Free (free of charge)
Free for personal and commercial use.
Author: Awesome Content
Similar Free Stock Images

Premium


Premium

Premium


Premium


Premium

Premium


Premium


Premium


Premium

Premium

Premium


Premium


Premium


Premium


Premium


Premium


Premium


Premium


Premium


Premium


Premium

Premium

Premium


Premium


Premium


Explore More Free Stock Images