
- Home >
- Stock Photos >
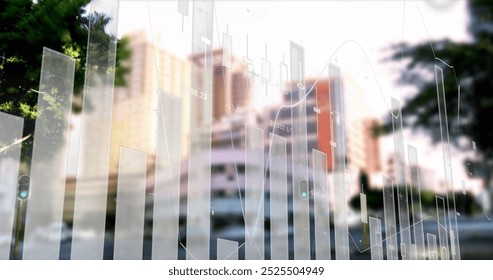
- Cityscape with Digital Graphs Reflecting Data Analytics
Cityscape with Digital Graphs Reflecting Data Analytics Image

The image shows an urban skyline with overlaid digital graphs and charts that represent data analytics. It combines elements of a cityscape with financial technology, illustrating global business concepts. Suitable for use in corporate presentations, technology blogs, or promotional materials related to data processing or financial analysis.
Powered by  - Get 15% off with code: PIKWIZARD15


downloads
Tags:
More
Credit Photo
If you would like to credit the Photo, here are some ways you can do so
Text Link
photo Link
<span class="text-link">
<span>
<a target="_blank" href=https://pikwizard.com/photo/cityscape-with-digital-graphs-reflecting-data-analytics/4417cd88b5d28c2e328f8bd197e33fff/>PikWizard</a>
</span>
</span>
<span class="image-link">
<span
style="margin: 0 0 20px 0; display: inline-block; vertical-align: middle; width: 100%;"
>
<a
target="_blank"
href="https://pikwizard.com/photo/cityscape-with-digital-graphs-reflecting-data-analytics/4417cd88b5d28c2e328f8bd197e33fff/"
style="text-decoration: none; font-size: 10px; margin: 0;"
>
<img src="https://pikwizard.com/pw/medium/4417cd88b5d28c2e328f8bd197e33fff.jpg" style="margin: 0; width: 100%;" alt="" />
<p style="font-size: 12px; margin: 0;">PikWizard</p>
</a>
</span>
</span>
Free (free of charge)
Free for personal and commercial use.
Author: Awesome Content