- Home >
- Stock Photos >
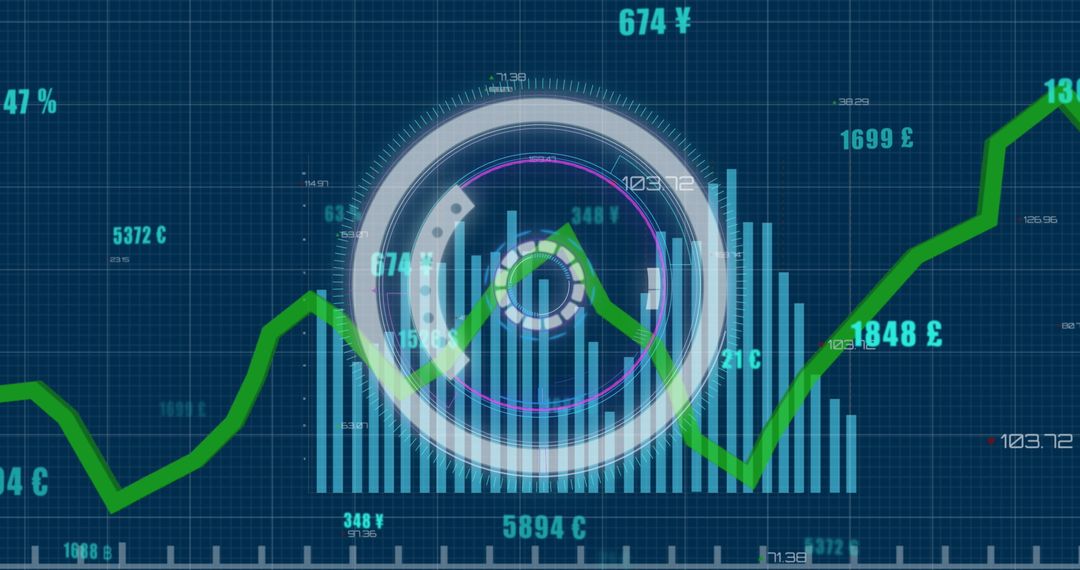
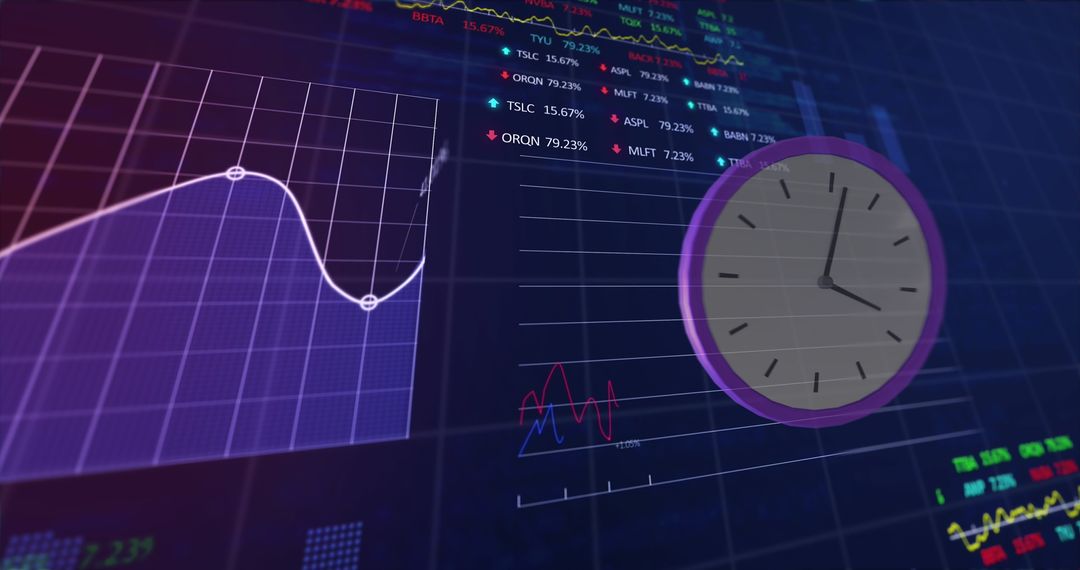
- Clock Overlapping Data Charts Displaying Business Growth Concepts
Clock Overlapping Data Charts Displaying Business Growth Concepts Image

Visual illustrating the integration of time with business analytics and statistical data analysis. Useful for business presentations, finance reports, technology brochures, and educational content on data processing techniques and trends.
Powered by  - Get 15% off with code: PIKWIZARD15


2
downloads
downloads
Tags:
More
Credit Photo
If you would like to credit the Photo, here are some ways you can do so
Text Link
photo Link
<span class="text-link">
<span>
<a target="_blank" href=https://pikwizard.com/photo/clock-overlapping-data-charts-displaying-business-growth-concepts/3ea2b929f4aea599cf6ae7f8c57079c4/>PikWizard</a>
</span>
</span>
<span class="image-link">
<span
style="margin: 0 0 20px 0; display: inline-block; vertical-align: middle; width: 100%;"
>
<a
target="_blank"
href="https://pikwizard.com/photo/clock-overlapping-data-charts-displaying-business-growth-concepts/3ea2b929f4aea599cf6ae7f8c57079c4/"
style="text-decoration: none; font-size: 10px; margin: 0;"
>
<img src="https://pikwizard.com/pw/medium/3ea2b929f4aea599cf6ae7f8c57079c4.jpg" style="margin: 0; width: 100%;" alt="" />
<p style="font-size: 12px; margin: 0;">PikWizard</p>
</a>
</span>
</span>
Free (free of charge)
Free for personal and commercial use.
Author: Creative Art
Similar Free Stock Images

Premium


Premium


Premium


Premium


Premium


Premium


Premium


Premium


Premium


Premium


Premium


Premium


Premium


Premium


Premium


Premium


Premium


Premium


Premium


Premium


Premium


Premium


Premium


Premium