
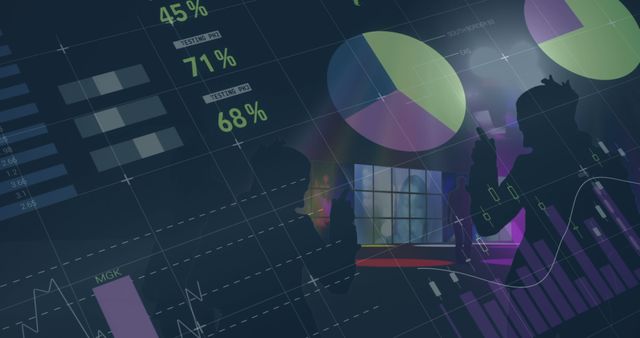
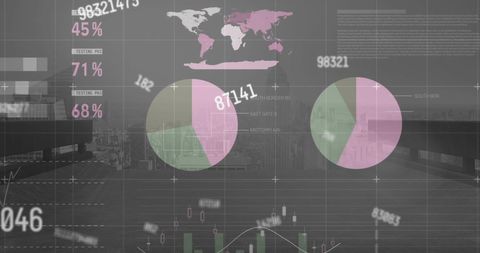
digital interface with financial charts and analytics Image
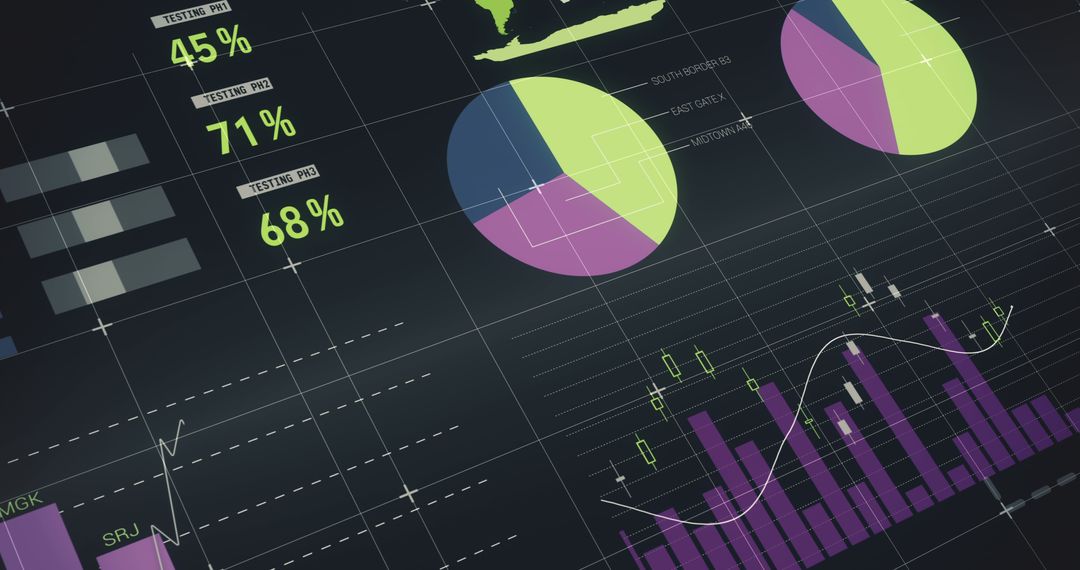
complex graphical representation of financial data, ideal for presentations, financial analysis reports, and investment company materials. useful for illustrating trends and forecasting economic growth. suitable for professionals in finance, analysts, and educators developing material on economic or business courses.
Powered by  - Get 15% off with code: PIKWIZARD15


41
downloads
downloads
Credit Photo
If you would like to credit the Photo, here are some ways you can do so
Text Link
photo Link
<span class="text-link">
<span>
<a target="_blank" href=https://pikwizard.com/photo/digital-interface-with-financial-charts-and-analytics/343f49b1606d82ac5027cdcd7f2ee3b6/>PikWizard</a>
</span>
</span>
<span class="image-link">
<span
style="margin: 0 0 20px 0; display: inline-block; vertical-align: middle; width: 100%;"
>
<a
target="_blank"
href="https://pikwizard.com/photo/digital-interface-with-financial-charts-and-analytics/343f49b1606d82ac5027cdcd7f2ee3b6/"
style="text-decoration: none; font-size: 10px; margin: 0;"
>
<img src="https://pikwizard.com/pw/medium/343f49b1606d82ac5027cdcd7f2ee3b6.jpg" style="margin: 0; width: 100%;" alt="" />
<p style="font-size: 12px; margin: 0;">PikWizard</p>
</a>
</span>
</span>
Free (free of charge)
Free for personal and commercial use.
Author: Creative Art
Similar Free Stock Images


Premium

Premium


Premium

Premium


Premium


Premium


Premium


Premium


Premium

Premium


Premium

Premium

Premium

Premium


Premium

Premium


Premium


Premium


Premium

Premium


Premium


Premium


Premium


Premium

Premium

