- Home >
- Stock Photos >
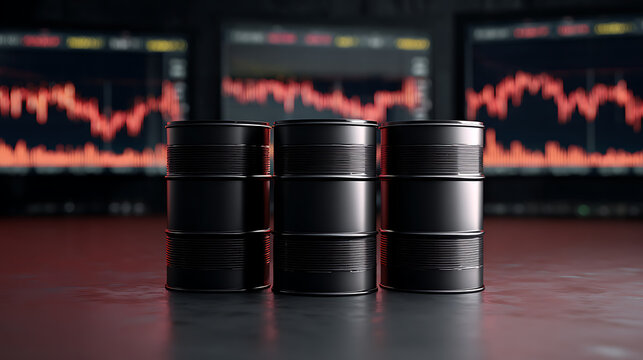
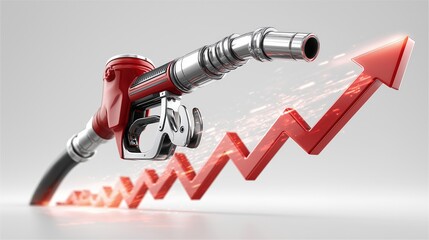
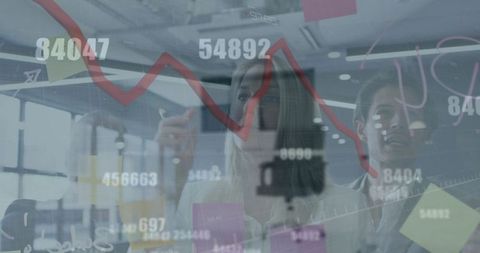
- Close-Up of Petrol Nozzles Overlaying Financial Charts and Calculator
Close-Up of Petrol Nozzles Overlaying Financial Charts and Calculator Image

Fusion of petrol nozzles with financial charts symbolizes impact of energy prices on economy. Suitable for articles on fuel pricing, economic trends, or business analytics. Ideal for illustrating concepts in the energy sector or inflation discussions, showcasing interconnectedness of markets and technologies.
Powered by 


2
downloads
downloads
Tags:
More
Credit Photo
If you would like to credit the Photo, here are some ways you can do so
Text Link
photo Link
<span class="text-link">
<span>
<a target="_blank" href=https://pikwizard.com/photo/close-up-of-petrol-nozzles-overlaying-financial-charts-and-calculator/7873c56153cbb7faeb05a107ec19333d/>PikWizard</a>
</span>
</span>
<span class="image-link">
<span
style="margin: 0 0 20px 0; display: inline-block; vertical-align: middle; width: 100%;"
>
<a
target="_blank"
href="https://pikwizard.com/photo/close-up-of-petrol-nozzles-overlaying-financial-charts-and-calculator/7873c56153cbb7faeb05a107ec19333d/"
style="text-decoration: none; font-size: 10px; margin: 0;"
>
<img src="https://pikwizard.com/pw/medium/7873c56153cbb7faeb05a107ec19333d.jpg" style="margin: 0; width: 100%;" alt="" />
<p style="font-size: 12px; margin: 0;">PikWizard</p>
</a>
</span>
</span>
Free (free of charge)
Free for personal and commercial use.
Author: Authentic Images
Similar Free Stock Images
Loading...
Premium


Premium


Premium


Premium


Premium

Premium


Premium


Premium
Premium

Premium


Premium

Premium


Premium


Premium

Premium


Premium


Premium


Premium


Premium


Premium


Premium

Premium


Premium


Premium

Premium