
- Home >
- Stock Photos >
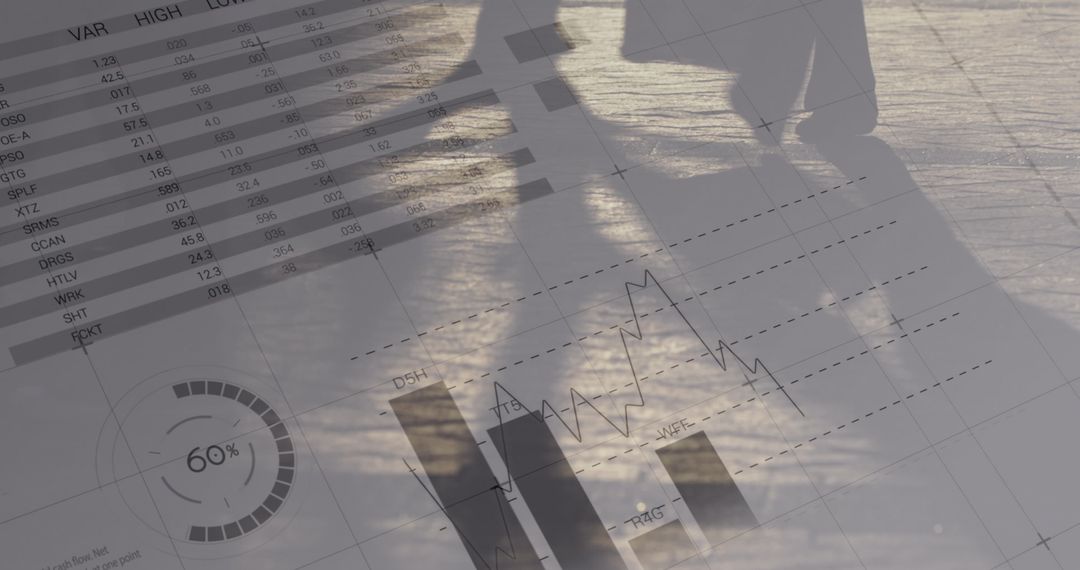
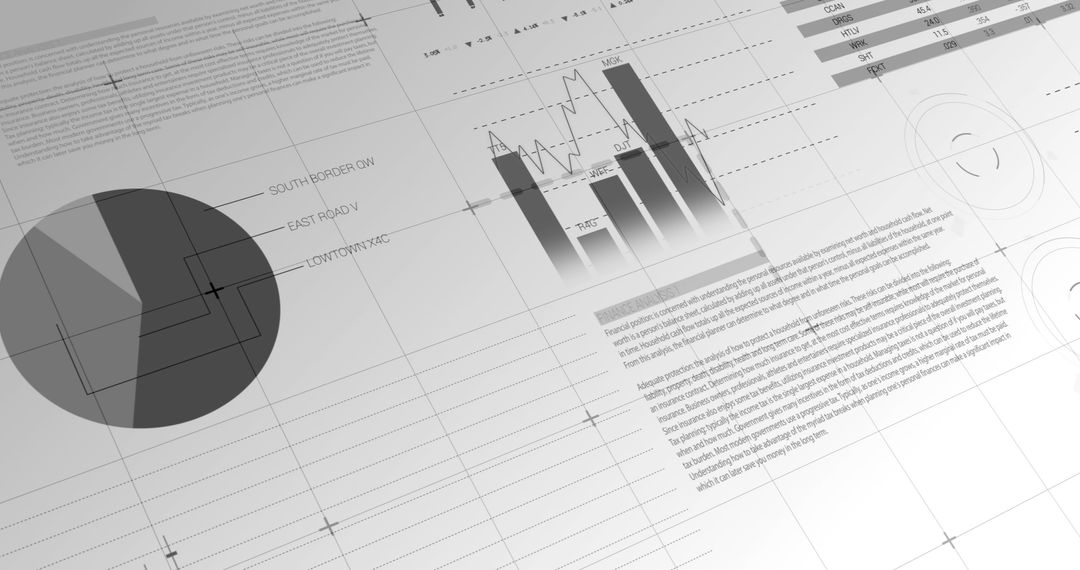
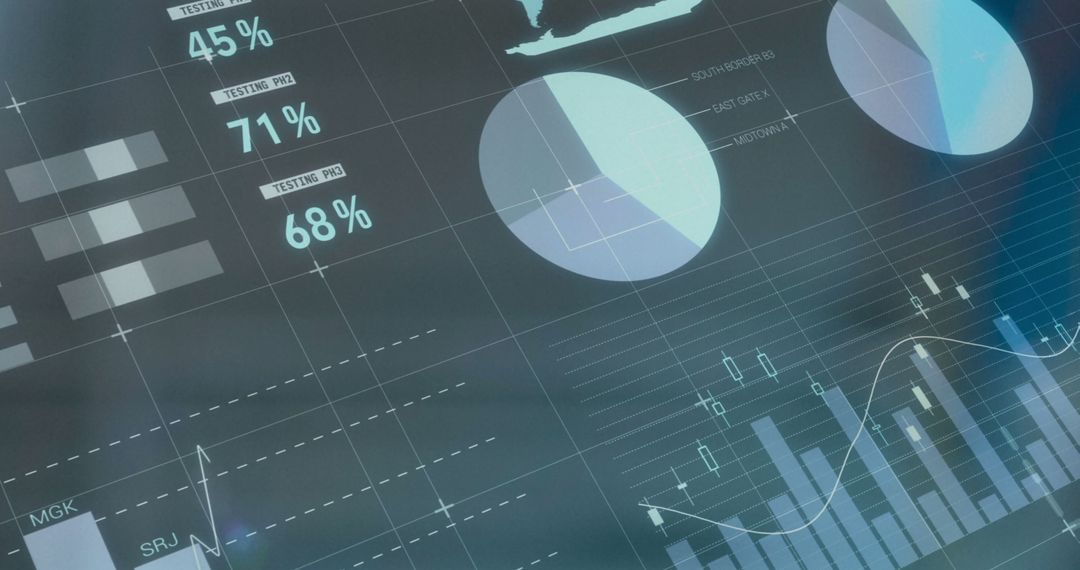
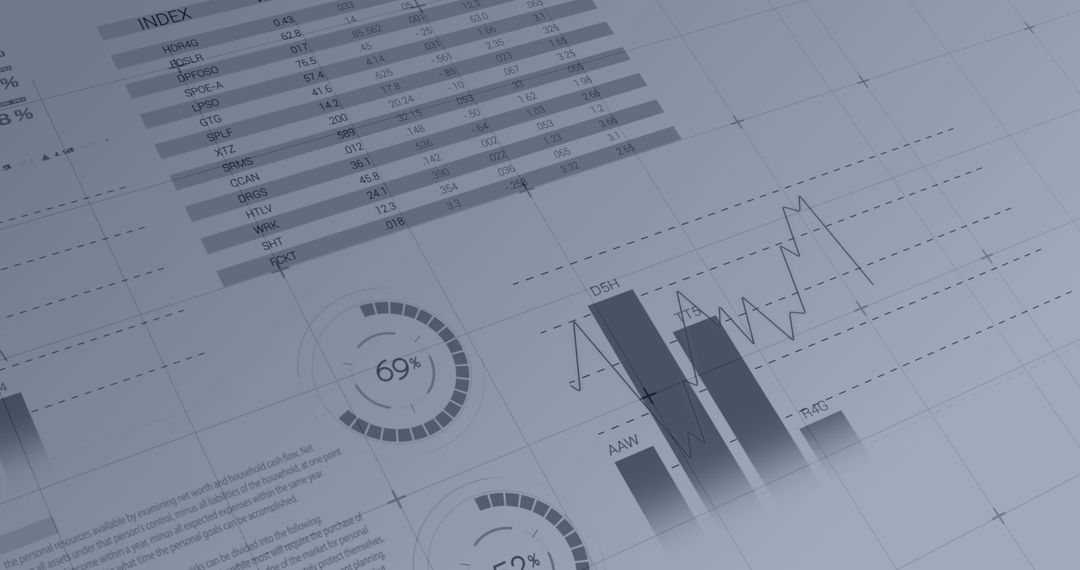
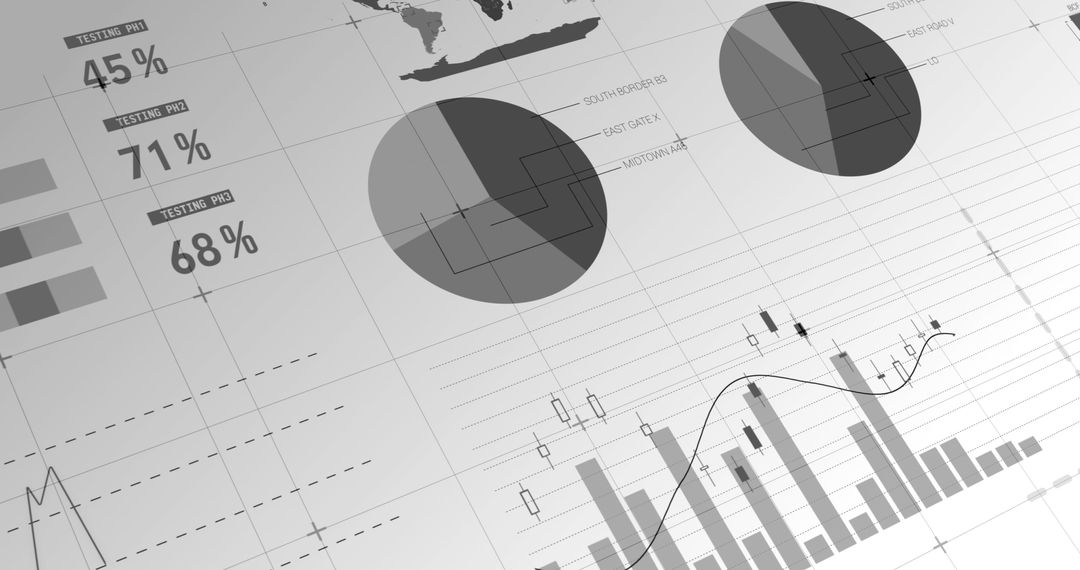
- Collaborative Analysis of Global Financial Data
Collaborative Analysis of Global Financial Data Image

Engaging image featuring diverse team of business professionals analyzing abstract financial data with charts and graphs overlay. Perfect for content focusing on teamwork in global finance, data-driven strategies, business intelligence, market analysis and collaborative decision-making. Ideal for use in industry reports, presentations, webinars, or marketing materials showcasing innovative global business solutions.
Powered by  - Get 15% off with code: PIKWIZARD15


0
downloads
downloads
Tags:
More
Credit Photo
If you would like to credit the Photo, here are some ways you can do so
Text Link
photo Link
<span class="text-link">
<span>
<a target="_blank" href=https://pikwizard.com/photo/collaborative-analysis-of-global-financial-data/98acc6e2743c736bd0ed053ce146f1d5/>PikWizard</a>
</span>
</span>
<span class="image-link">
<span
style="margin: 0 0 20px 0; display: inline-block; vertical-align: middle; width: 100%;"
>
<a
target="_blank"
href="https://pikwizard.com/photo/collaborative-analysis-of-global-financial-data/98acc6e2743c736bd0ed053ce146f1d5/"
style="text-decoration: none; font-size: 10px; margin: 0;"
>
<img src="https://pikwizard.com/pw/medium/98acc6e2743c736bd0ed053ce146f1d5.jpg" style="margin: 0; width: 100%;" alt="" />
<p style="font-size: 12px; margin: 0;">PikWizard</p>
</a>
</span>
</span>
Free (free of charge)
Free for personal and commercial use.
Author: Creative Art
Similar Free Stock Images
Premium


Premium


Premium


Premium


Premium


Premium


Premium


Premium


Premium


Premium


Premium


Premium


Premium


Premium


Premium


Premium


Premium


Premium


Premium


Premium


Premium


Premium


Premium


Premium

