
- Home >
- Stock Photos >
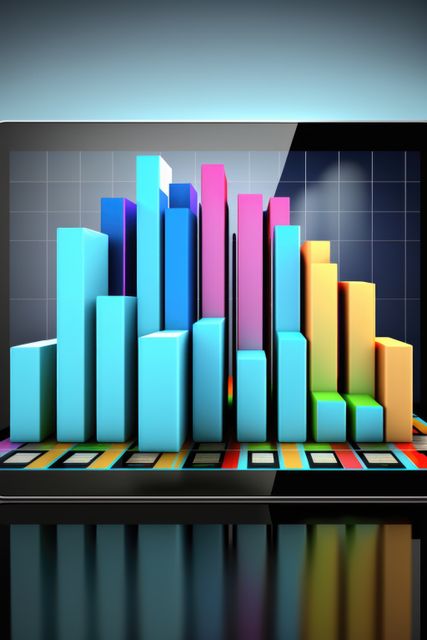
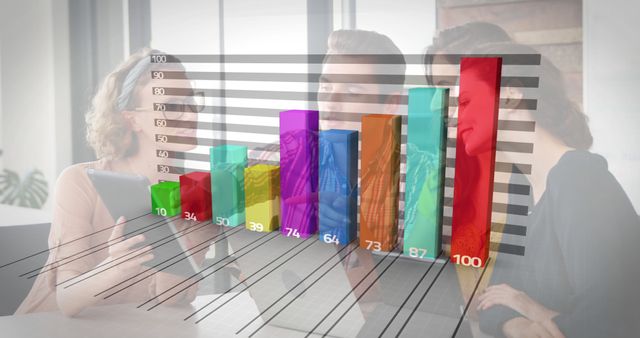
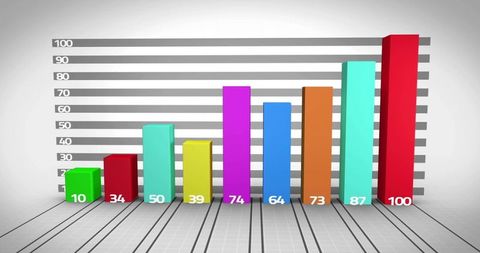
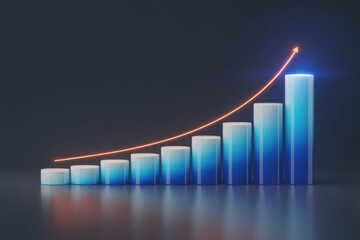
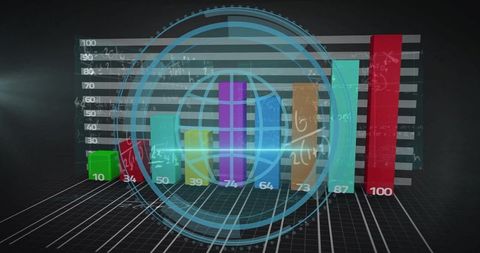
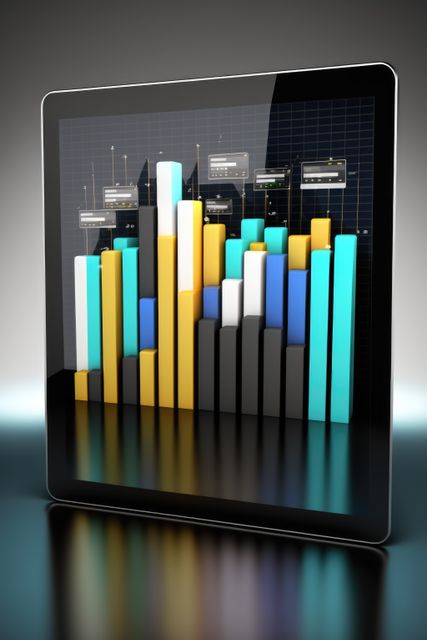
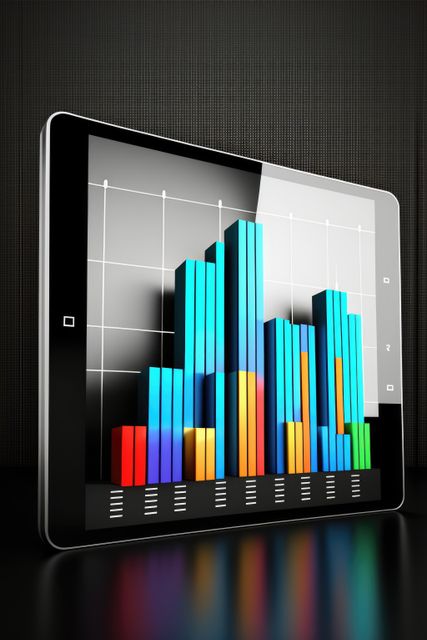
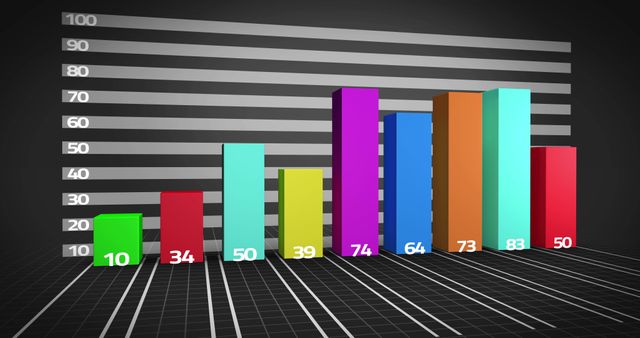
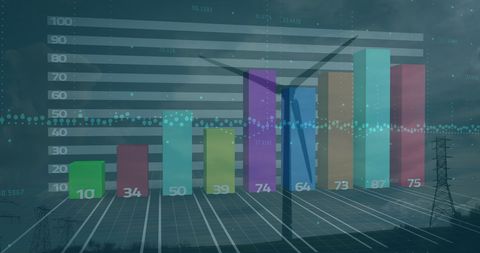
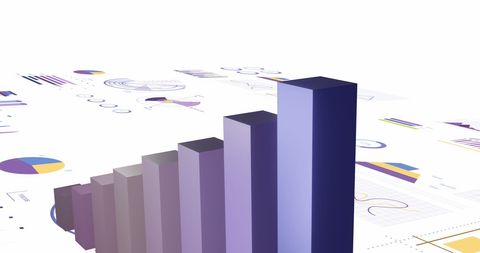
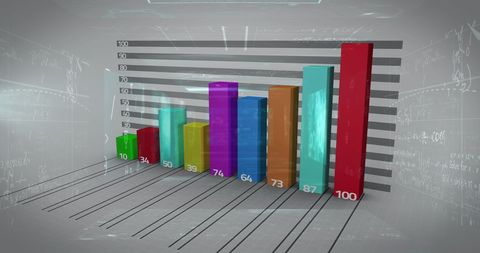
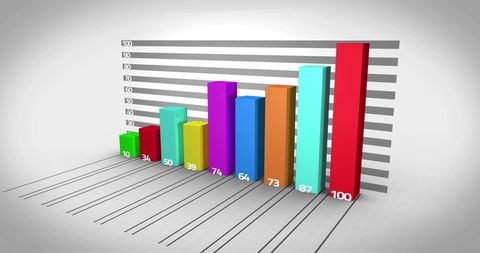
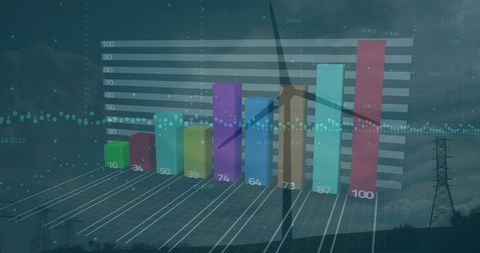
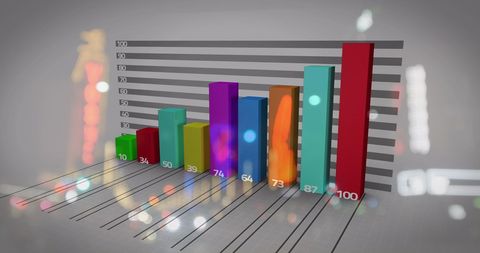
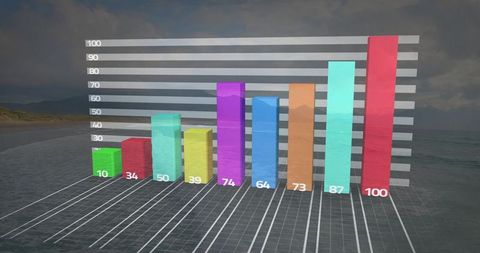
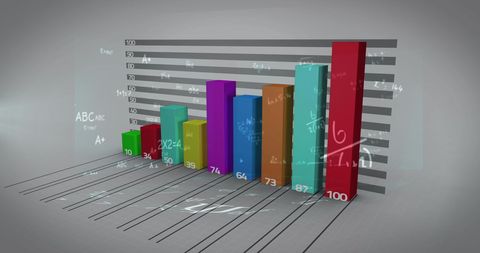
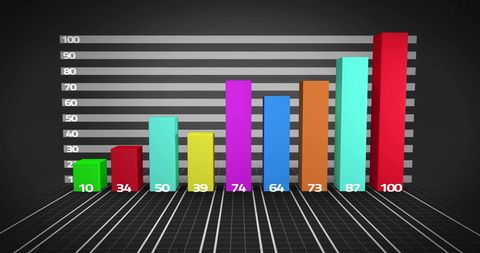
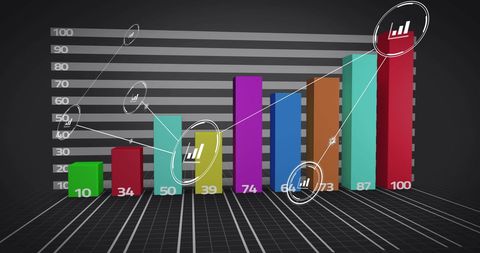
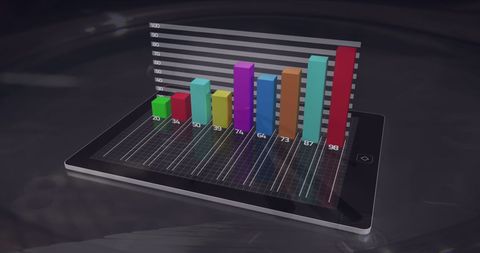
- Colorful 3D Bar Chart Displaying Data Progress Insights
Colorful 3D Bar Chart Displaying Data Progress Insights Image
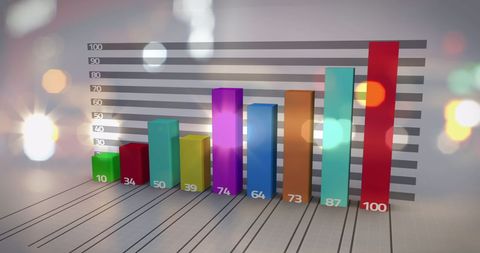
This image shows a vibrant 3D bar chart illustrating data trends and numerical progress. The visual representation is engaging with various colors highlighting individual data metrics, making it ideal for presentations or reports showcasing business analytics or technology development. It can be used as a feature image in marketing materials or websites focusing on financial growth, digital innovation, or data processing.
Powered by 


downloads
Tags:
More
Credit Photo
If you would like to credit the Photo, here are some ways you can do so
Text Link
photo Link
<span class="text-link">
<span>
<a target="_blank" href=https://pikwizard.com/photo/colorful-3d-bar-chart-displaying-data-progress-insights/03788f9faedf22fc0efbfc5391af4c77/>PikWizard</a>
</span>
</span>
<span class="image-link">
<span
style="margin: 0 0 20px 0; display: inline-block; vertical-align: middle; width: 100%;"
>
<a
target="_blank"
href="https://pikwizard.com/photo/colorful-3d-bar-chart-displaying-data-progress-insights/03788f9faedf22fc0efbfc5391af4c77/"
style="text-decoration: none; font-size: 10px; margin: 0;"
>
<img src="https://pikwizard.com/pw/medium/03788f9faedf22fc0efbfc5391af4c77.jpg" style="margin: 0; width: 100%;" alt="" />
<p style="font-size: 12px; margin: 0;">PikWizard</p>
</a>
</span>
</span>
Free (free of charge)
Free for personal and commercial use.
Author: People Creations
Similar Free Stock Images
Premium


AI


Premium


Premium


AI


Premium


AI

Premium


Premium


Premium

Premium

Premium


Premium


Premium
AI

AI


AI
Premium

AI

Premium
AI

Premium


Premium


AI


Premium


Premium

Premium


Premium


Premium


Premium


Premium


Premium

Premium

Premium


Explore More Free Stock Images