- Home >
- Stock Photos >
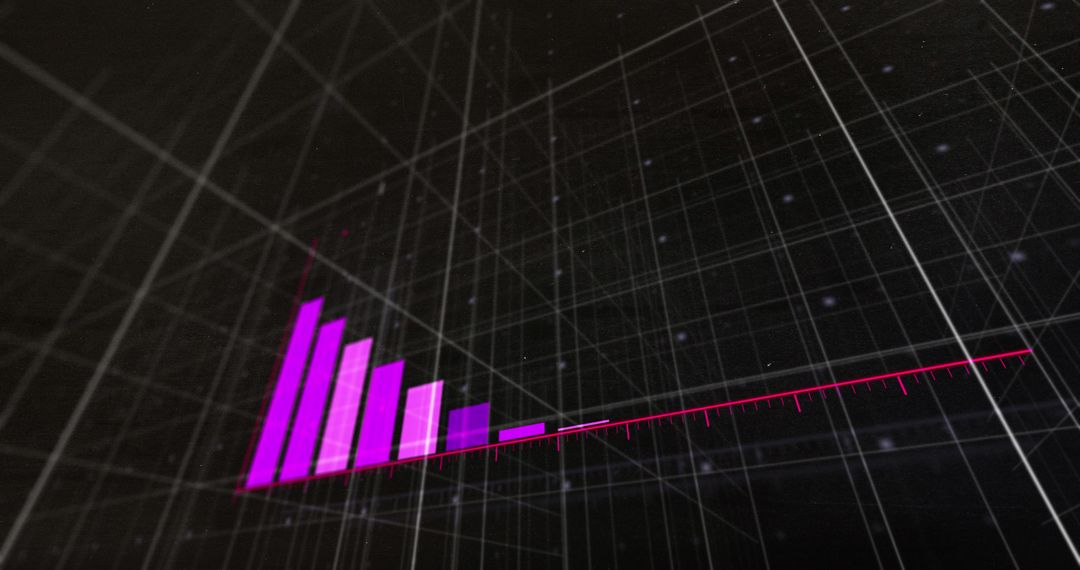
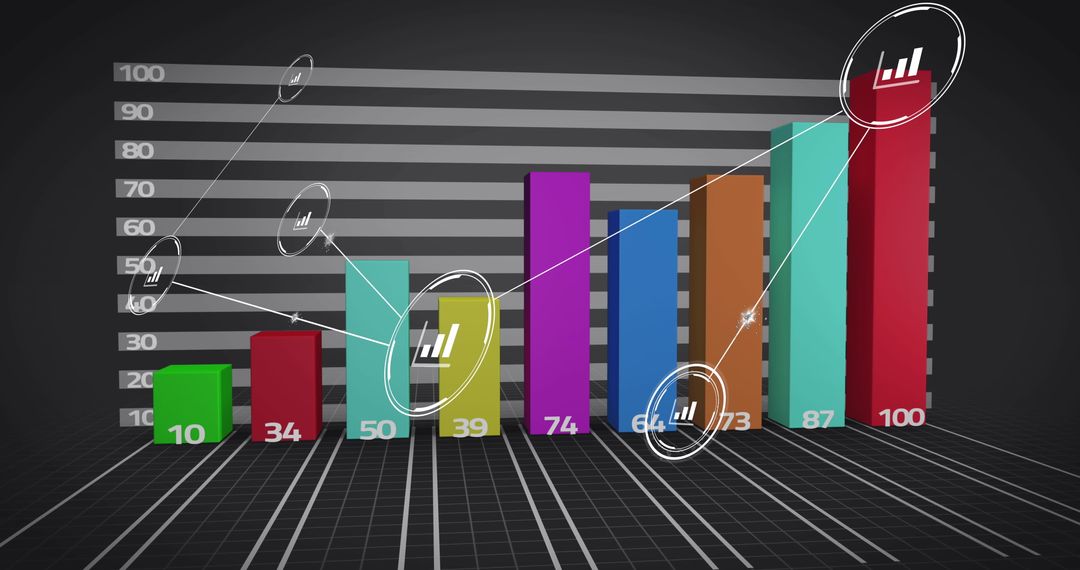
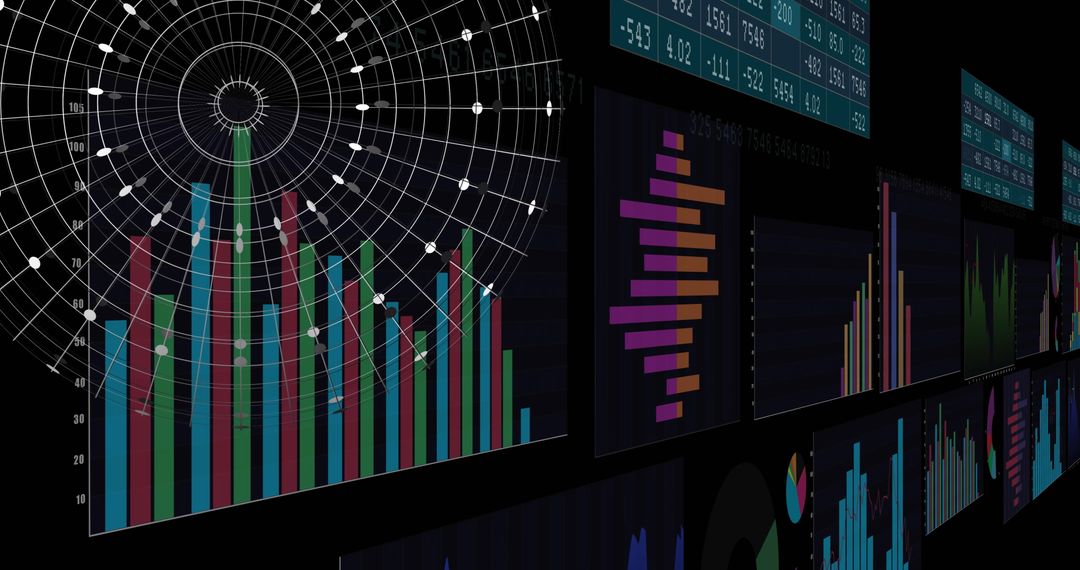
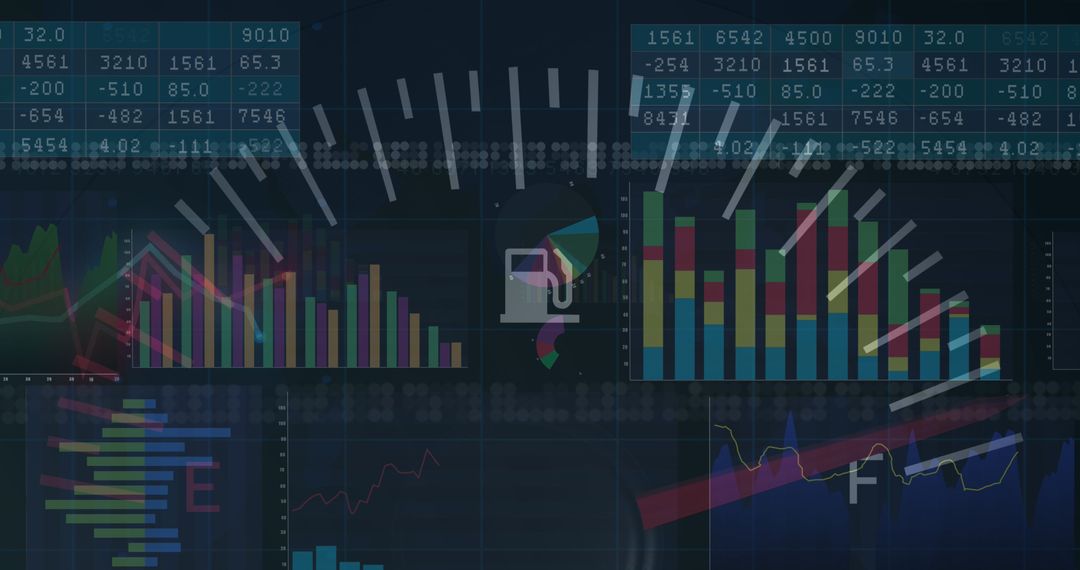
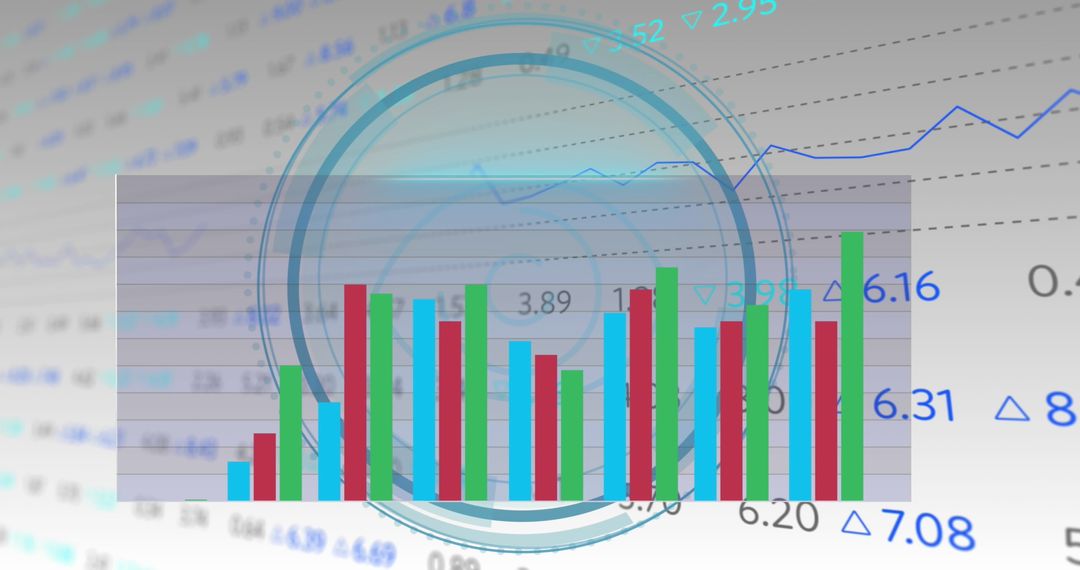
- Colorful 3D Bar Chart Visualizing Financial Data with Neon Candlestick Grid Overlay
Colorful 3D Bar Chart Visualizing Financial Data with Neon Candlestick Grid Overlay Image

High-contrast neon 3D bar chart combining colorful vertical bars, grid lines, numerical overlays, and candlestick elements for modern finance visuals. Useful for illustrating financial performance, market trends, sales growth, and KPI tracking across presentations and reports. Working well for corporate slides, investor pitches, website hero banners, social media posts, and blog headers. Customizable for adding logos, annotations, or slide text; pairing with animated transitions and data overlays for video, web dashboards, or interactive reports.
Powered by 


0
downloads
downloads
Tags:
More
Credit Photo
If you would like to credit the Photo, here are some ways you can do so
Text Link
photo Link
<span class="text-link">
<span>
<a target="_blank" href=https://pikwizard.com/photo/colorful-3d-bar-chart-visualizing-financial-data-with-neon-candlestick-grid-overlay/51a182181205ef59306761a6f957f996/>PikWizard</a>
</span>
</span>
<span class="image-link">
<span
style="margin: 0 0 20px 0; display: inline-block; vertical-align: middle; width: 100%;"
>
<a
target="_blank"
href="https://pikwizard.com/photo/colorful-3d-bar-chart-visualizing-financial-data-with-neon-candlestick-grid-overlay/51a182181205ef59306761a6f957f996/"
style="text-decoration: none; font-size: 10px; margin: 0;"
>
<img src="https://pikwizard.com/pw/medium/51a182181205ef59306761a6f957f996.jpg" style="margin: 0; width: 100%;" alt="" />
<p style="font-size: 12px; margin: 0;">PikWizard</p>
</a>
</span>
</span>
Free (free of charge)
Free for personal and commercial use.
Author: People Creations
Similar Free Stock Images

Premium


Premium


Premium


Premium


Premium


Premium


Premium


Premium


Premium


Premium


Premium


Premium


Premium


Premium


Premium


Premium


Premium


Premium


Premium


Premium


Premium


Premium


Premium


Premium