- Home >
- Stock Photos >
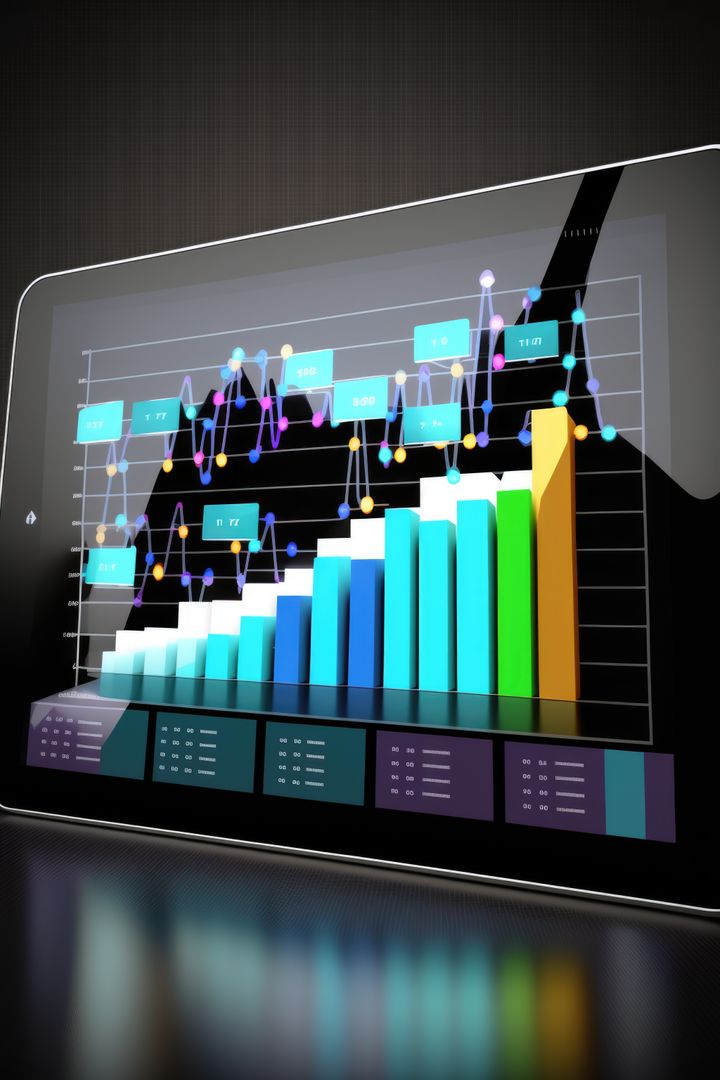
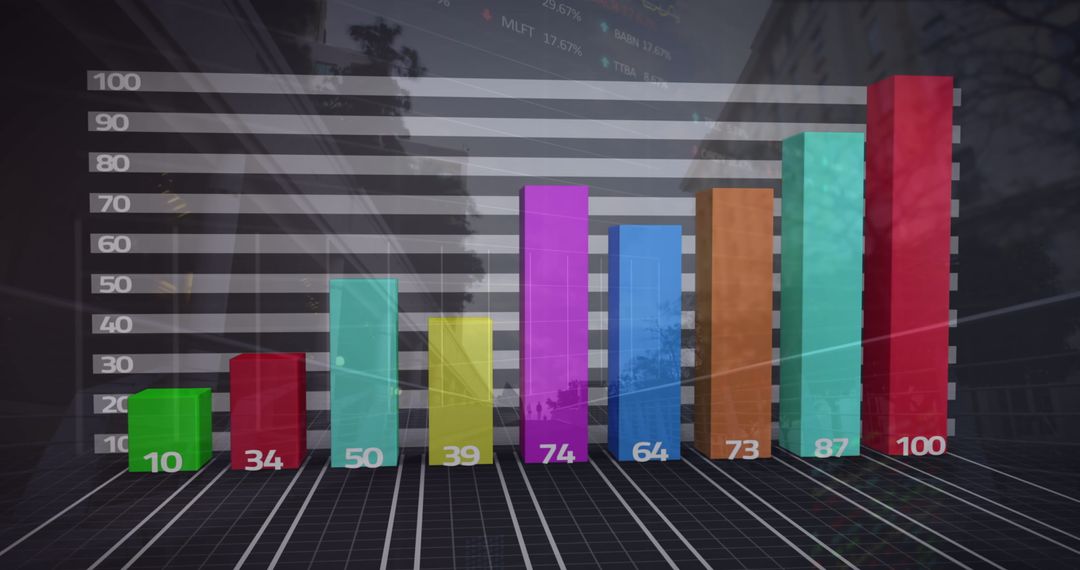
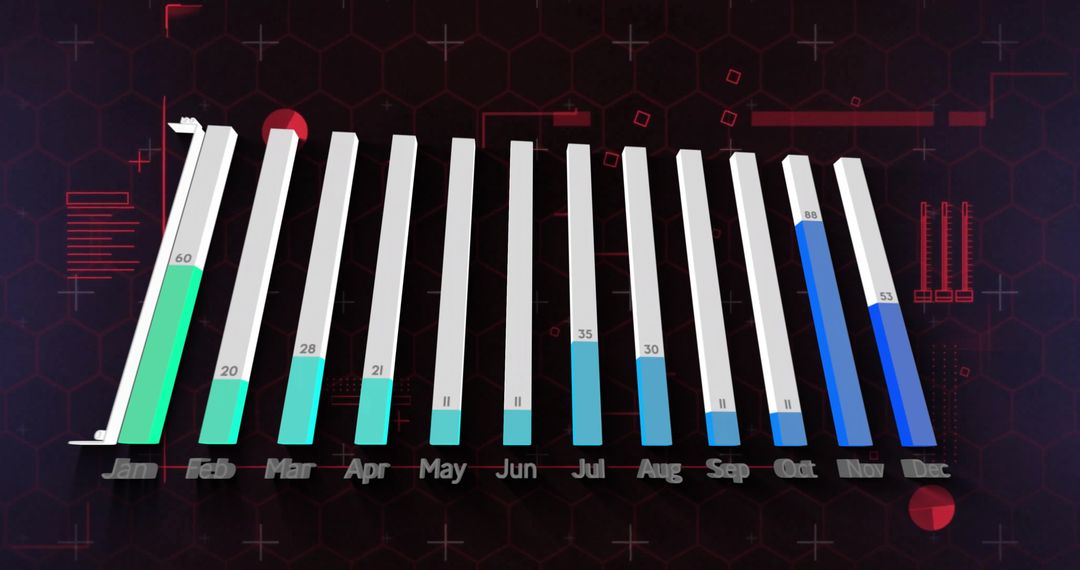
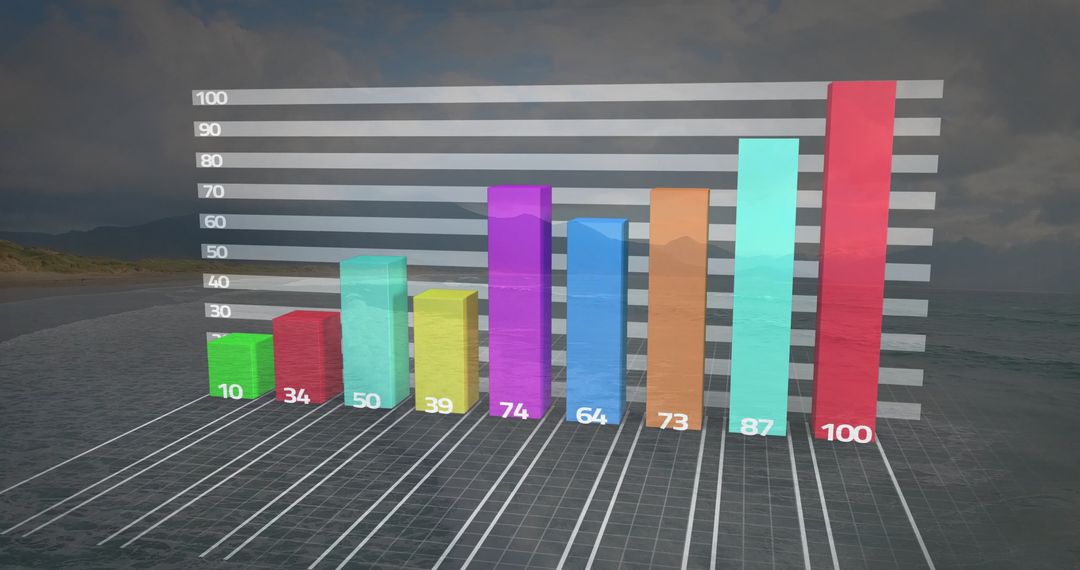
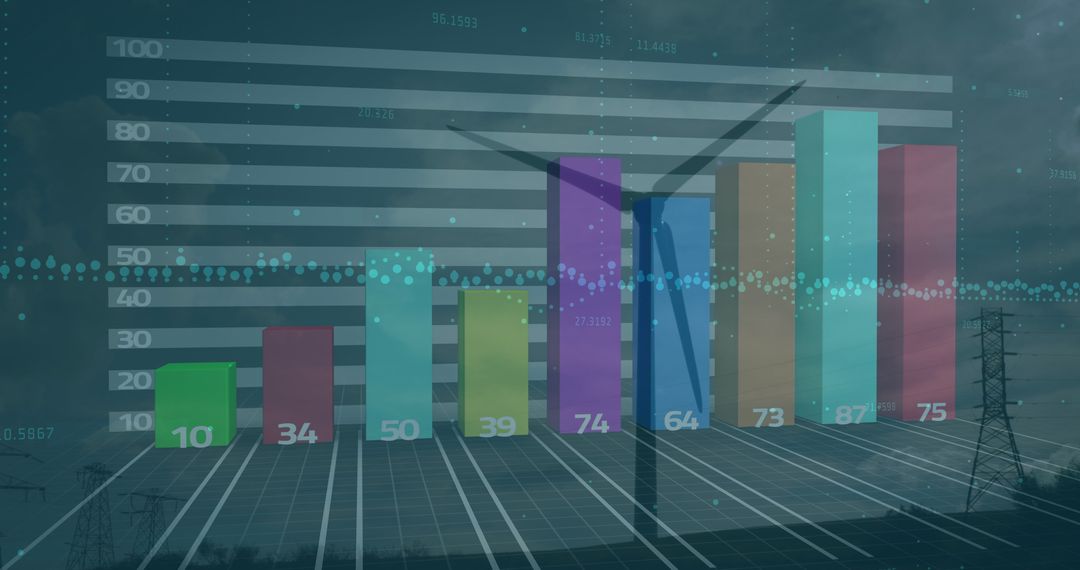
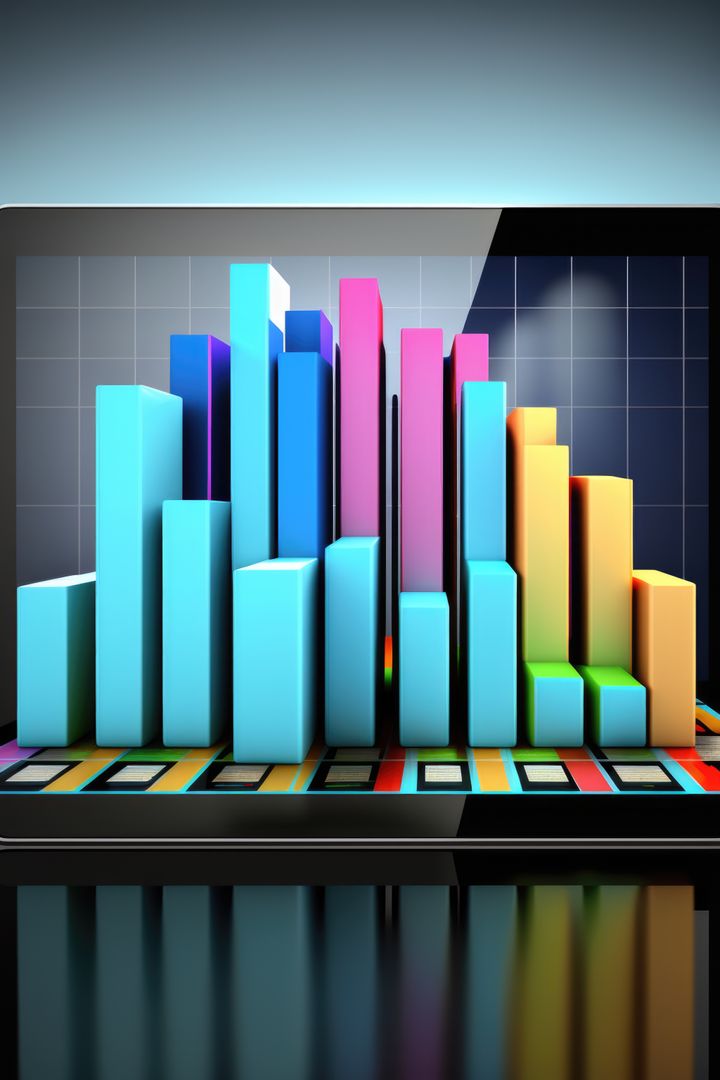
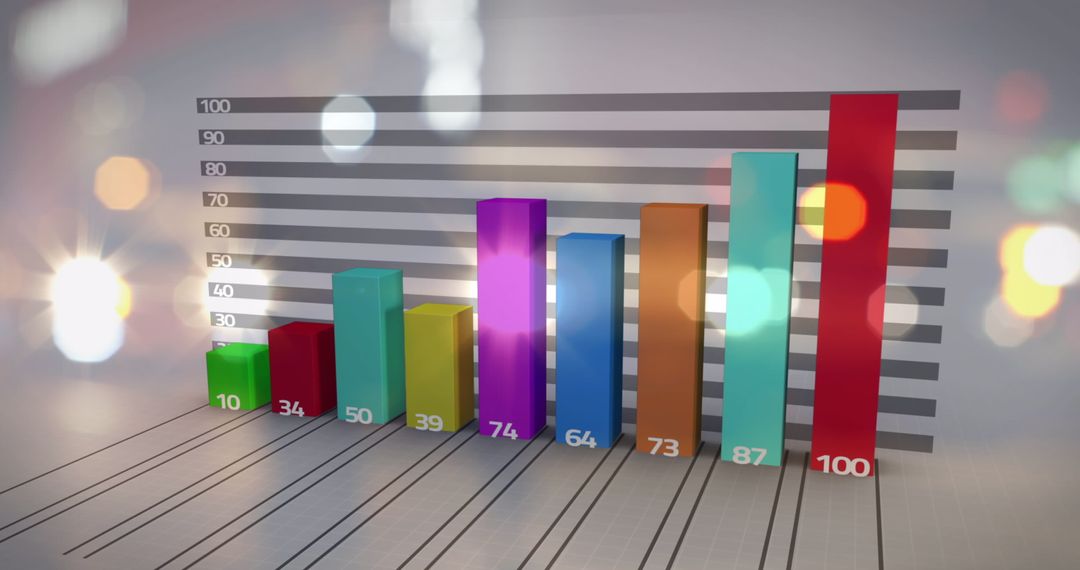
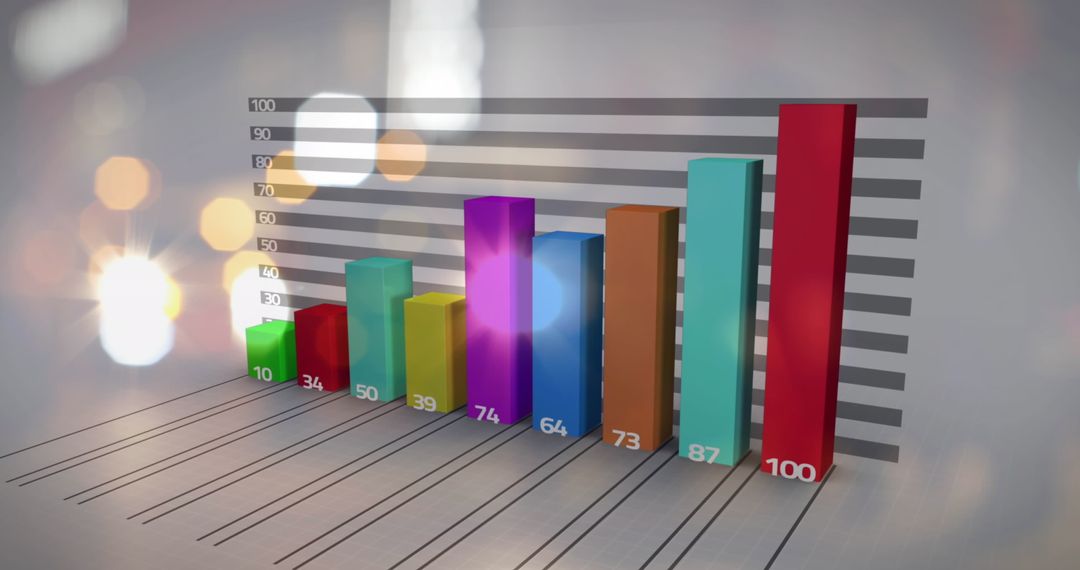
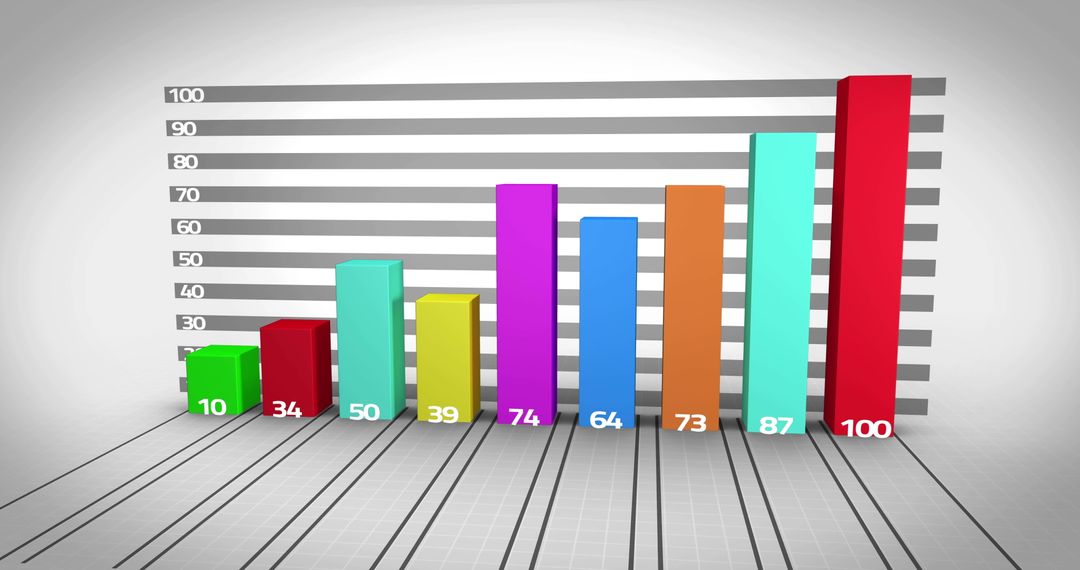
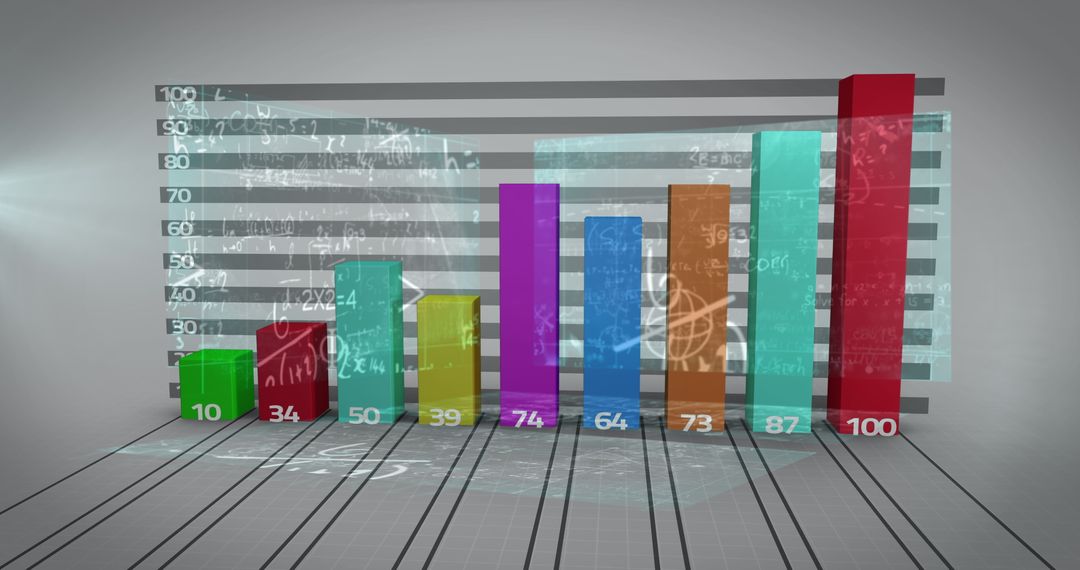
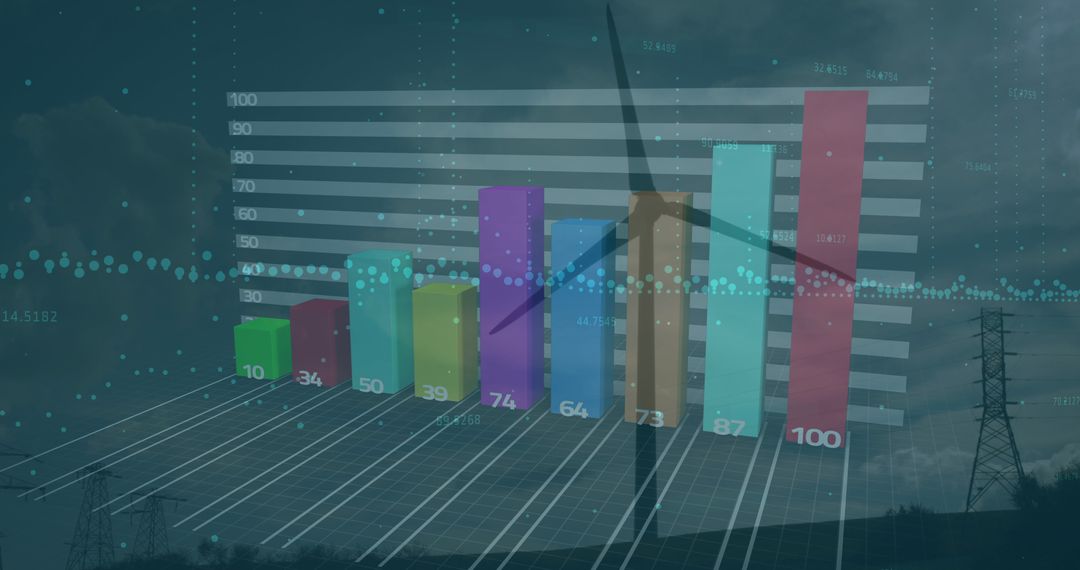
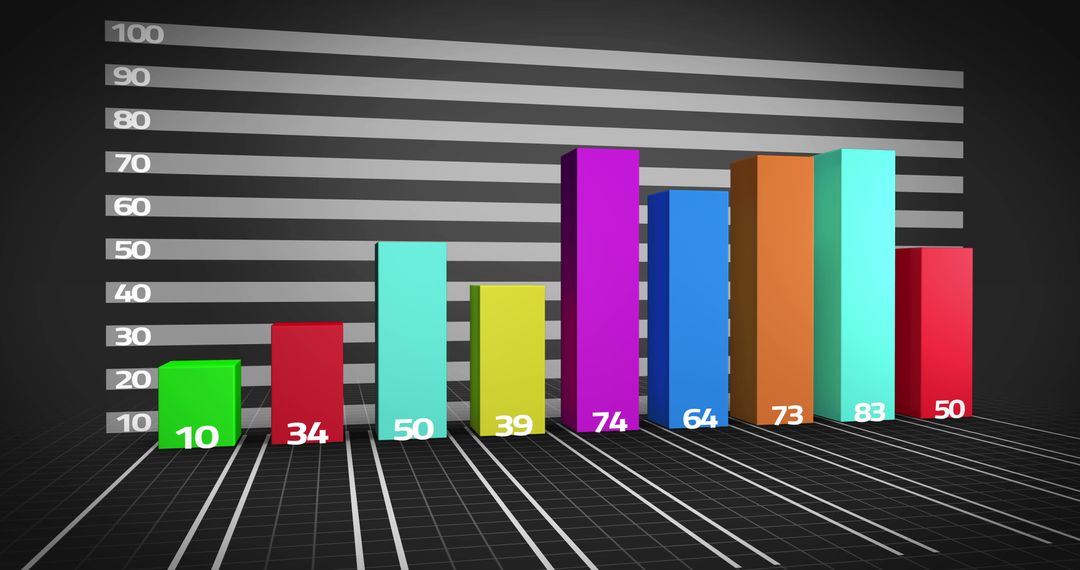
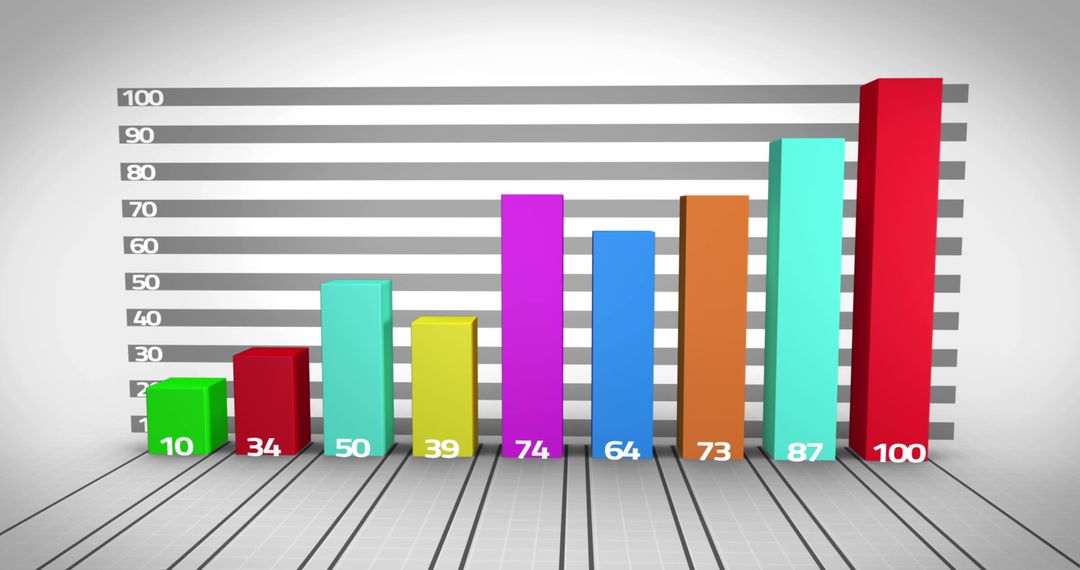
- Colorful 3D Bar Graph Depicting Financial Data
Colorful 3D Bar Graph Depicting Financial Data Image
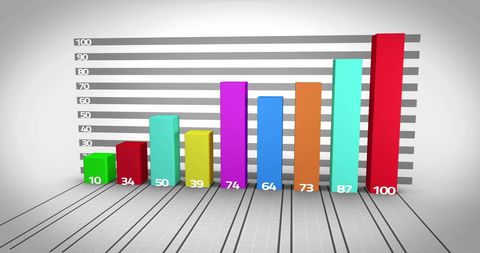
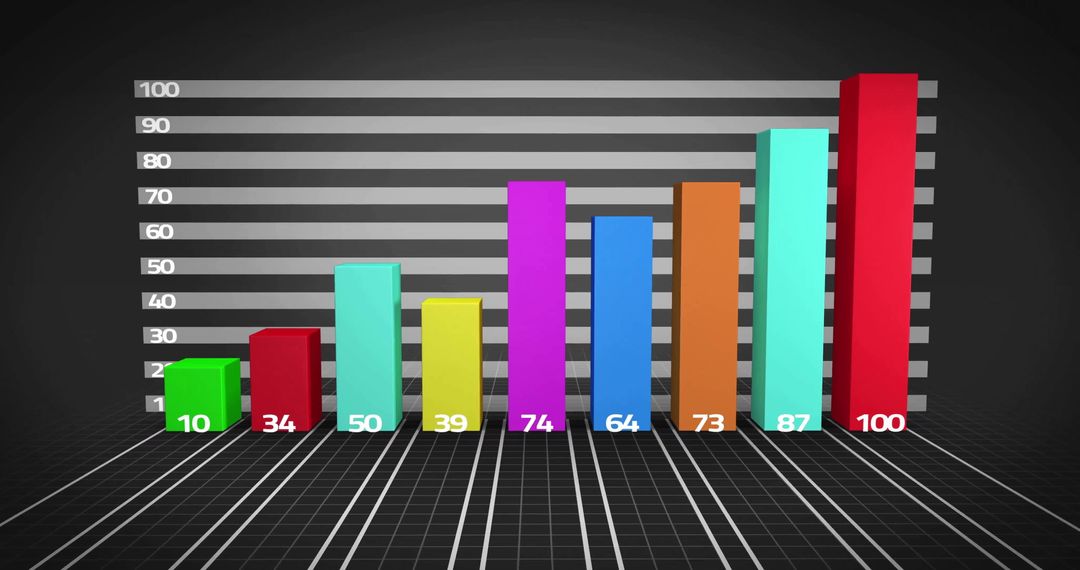
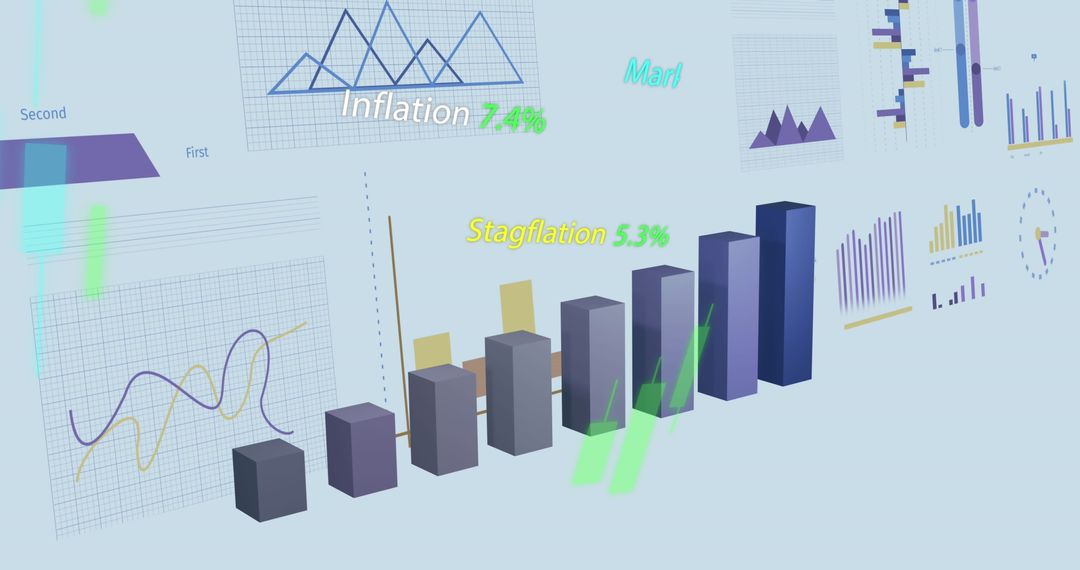
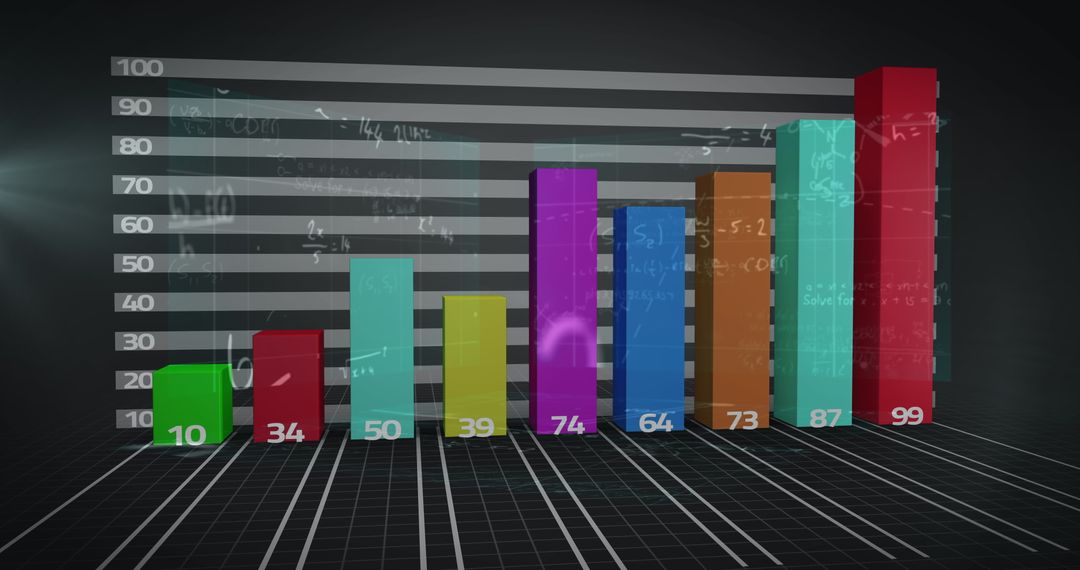
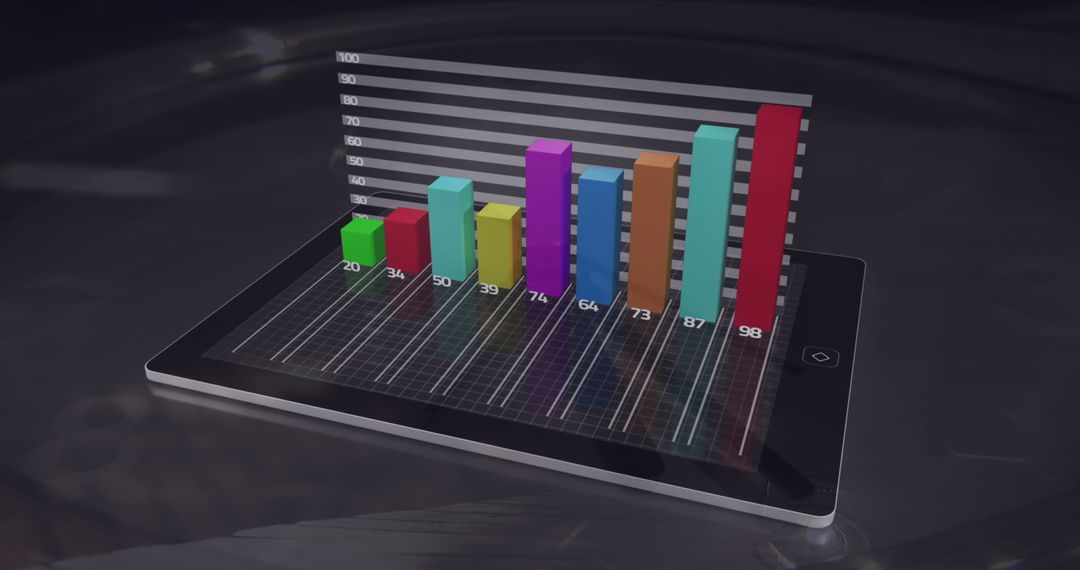
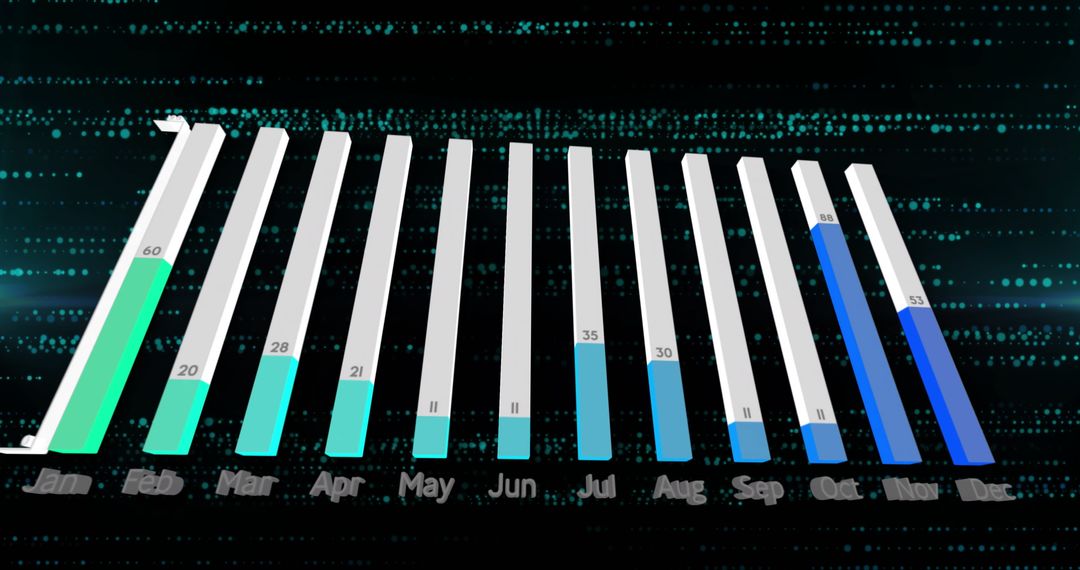
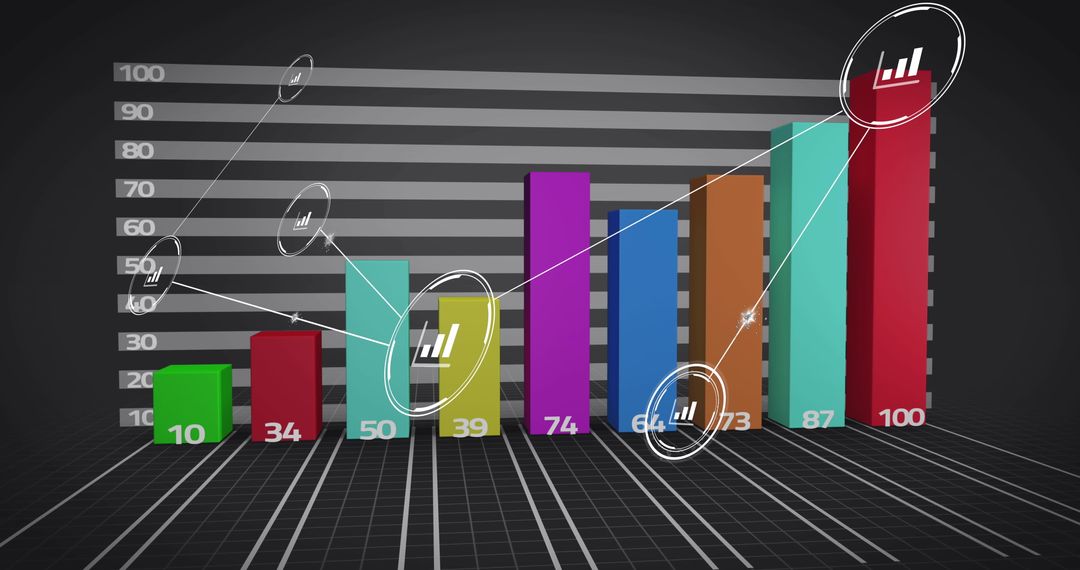
Colorful 3D bar graph representing financial or statistical data in a visually engaging format. Useful for business presentations, reports, educational materials, or articles discussing economic trends and analysis. The use of vivid colors makes the information easy to interpret and visually appealing, helping to convey data details robustly.
Powered by 


3
downloads
downloads
Tags:
More
Credit Photo
If you would like to credit the Photo, here are some ways you can do so
Text Link
photo Link
<span class="text-link">
<span>
<a target="_blank" href=https://pikwizard.com/photo/colorful-3d-bar-graph-depicting-financial-data/10468a59d4c1cefe86e4083466f12087/>PikWizard</a>
</span>
</span>
<span class="image-link">
<span
style="margin: 0 0 20px 0; display: inline-block; vertical-align: middle; width: 100%;"
>
<a
target="_blank"
href="https://pikwizard.com/photo/colorful-3d-bar-graph-depicting-financial-data/10468a59d4c1cefe86e4083466f12087/"
style="text-decoration: none; font-size: 10px; margin: 0;"
>
<img src="https://pikwizard.com/pw/medium/10468a59d4c1cefe86e4083466f12087.jpg" style="margin: 0; width: 100%;" alt="" />
<p style="font-size: 12px; margin: 0;">PikWizard</p>
</a>
</span>
</span>
Free (free of charge)
Free for personal and commercial use.
Author: People Creations
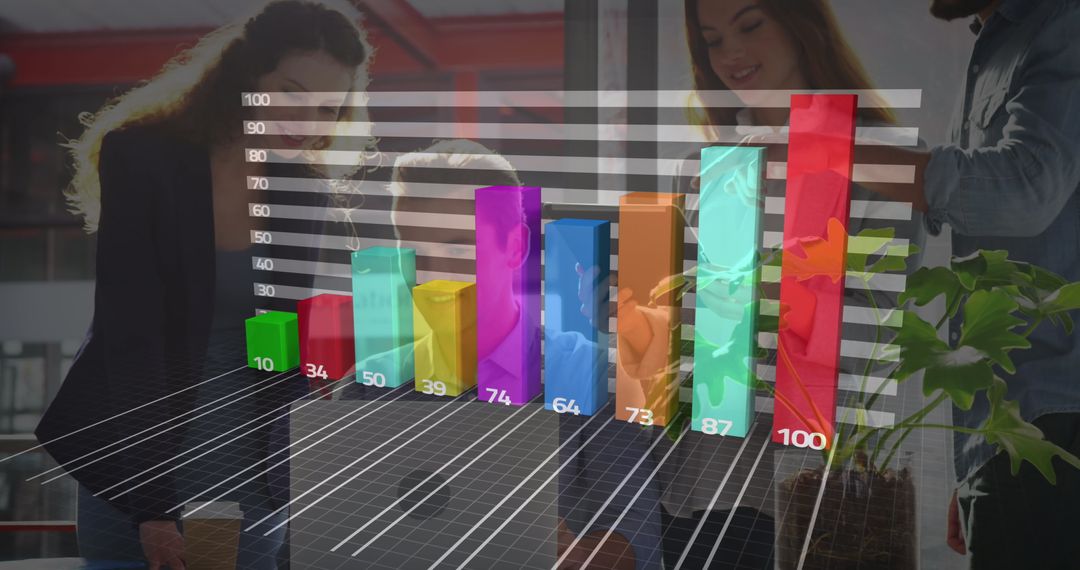
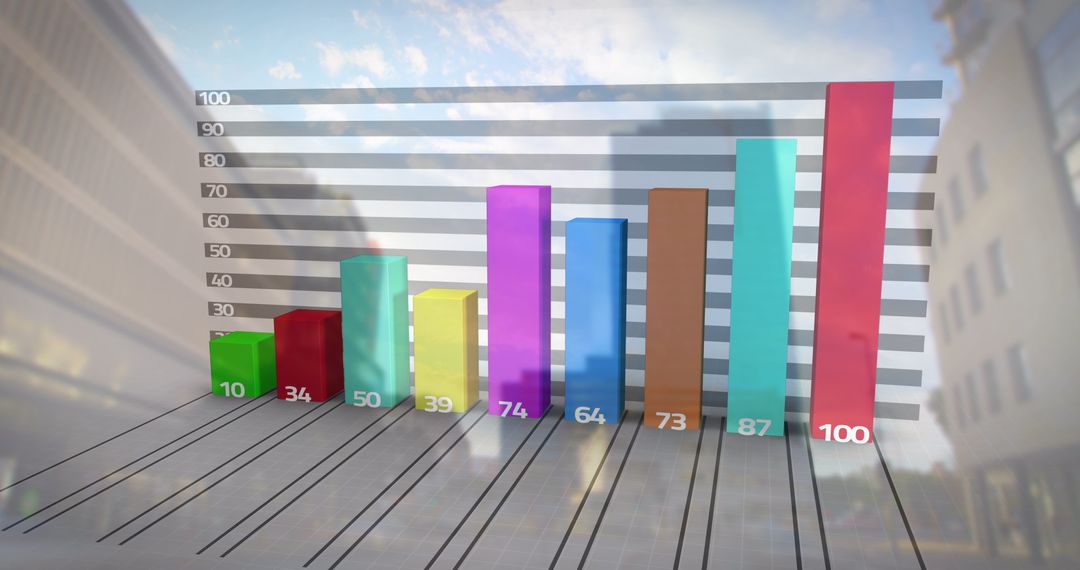
Similar Free Stock Images

Premium


Premium


Premium


Premium


Premium


Premium


Premium


Premium


Premium


Premium


Premium


Premium


Premium


Premium


Premium


Premium


Premium


Premium


Premium


Premium


Premium


Premium


Premium


Premium