- Home >
- Stock Photos >
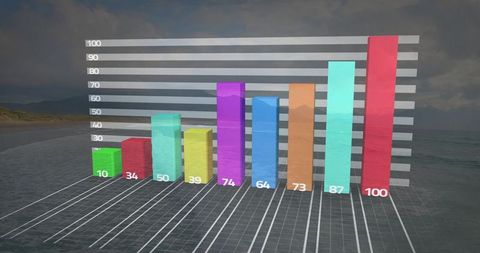
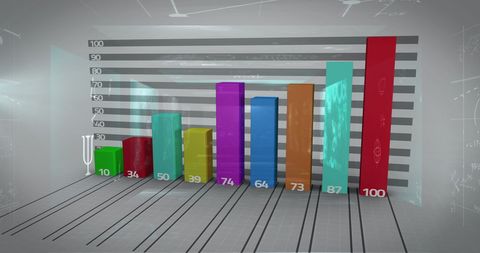
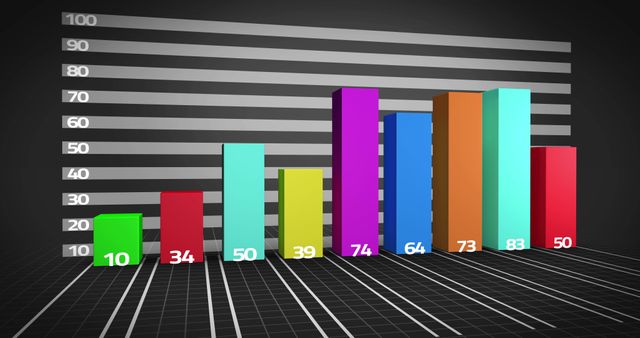
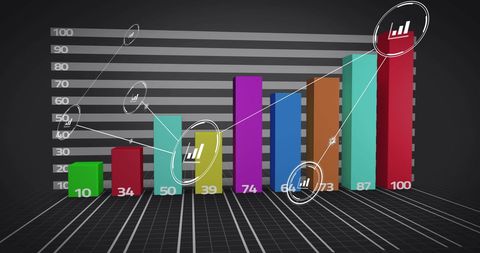
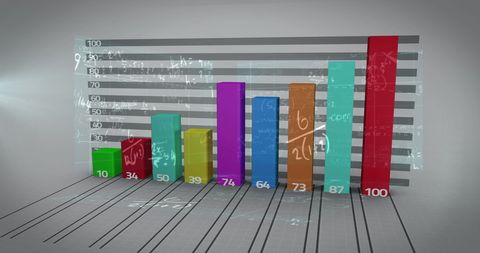
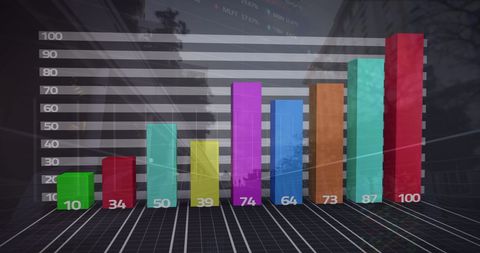
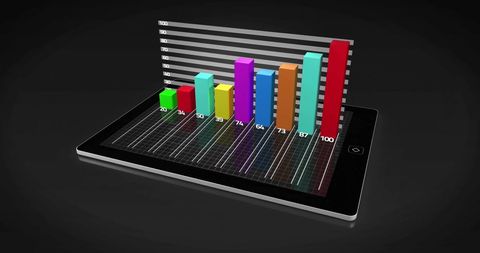
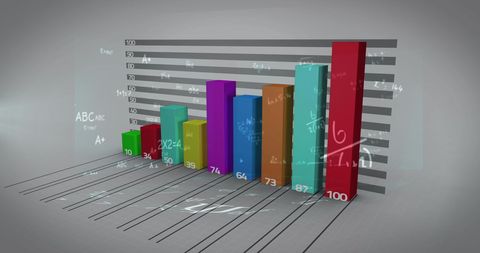
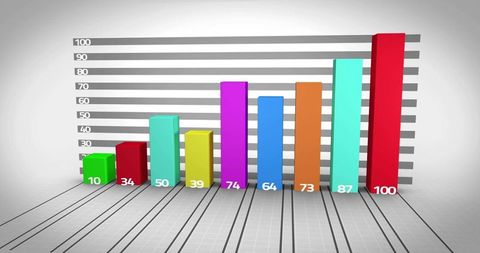
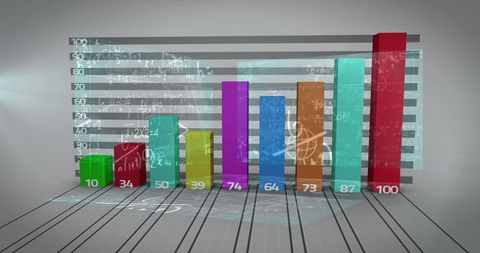
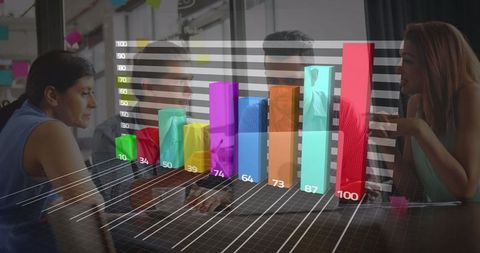
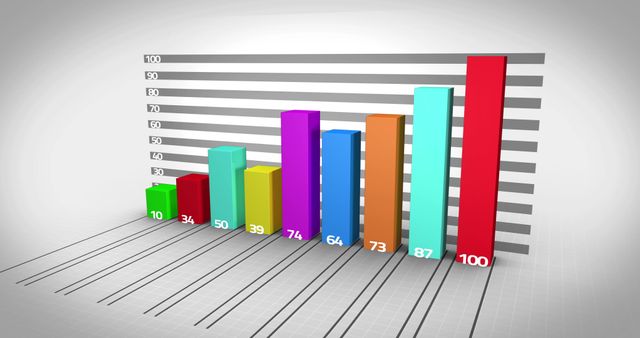
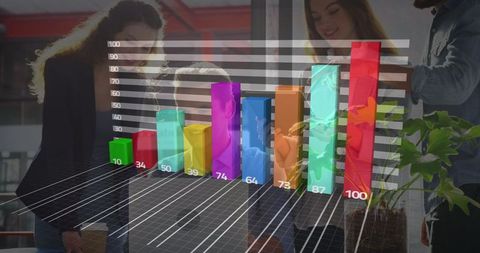
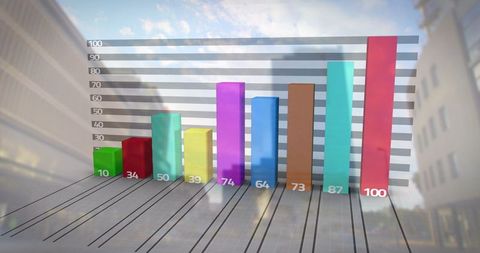
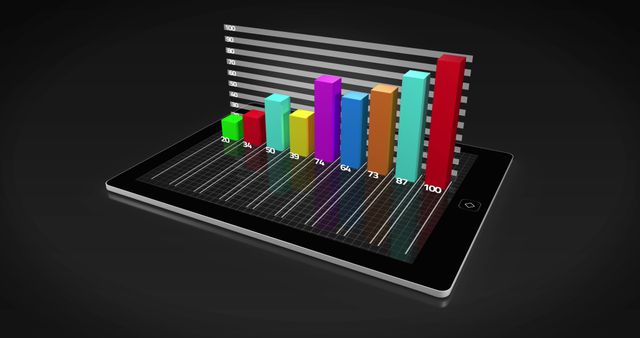
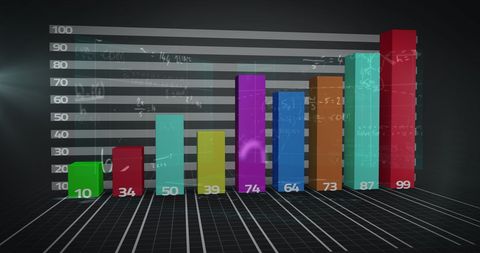
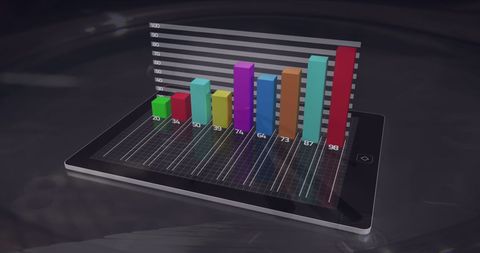
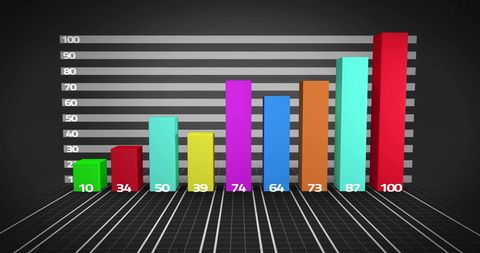
- Colorful 3D Bar Graph Overlay on Cityscape
Colorful 3D Bar Graph Overlay on Cityscape Image

3D bar graph with vibrant colors is overlaying an abstract cityscape, representing financial data processing. Useful for illustrating financial reports, business growth, analytics, and digital transformation themes.
Powered by  - Get 15% off with code: PIKWIZARD15


2
downloads
downloads
Tags:
More
Credit Photo
If you would like to credit the Photo, here are some ways you can do so
Text Link
photo Link
<span class="text-link">
<span>
<a target="_blank" href=https://pikwizard.com/photo/colorful-3d-bar-graph-overlay-on-cityscape/931af2816d0574e9950f2182e07c8281/>PikWizard</a>
</span>
</span>
<span class="image-link">
<span
style="margin: 0 0 20px 0; display: inline-block; vertical-align: middle; width: 100%;"
>
<a
target="_blank"
href="https://pikwizard.com/photo/colorful-3d-bar-graph-overlay-on-cityscape/931af2816d0574e9950f2182e07c8281/"
style="text-decoration: none; font-size: 10px; margin: 0;"
>
<img src="https://pikwizard.com/pw/medium/931af2816d0574e9950f2182e07c8281.jpg" style="margin: 0; width: 100%;" alt="" />
<p style="font-size: 12px; margin: 0;">PikWizard</p>
</a>
</span>
</span>
Free (free of charge)
Free for personal and commercial use.
Author: Awesome Content
Similar Free Stock Images
Loading...


Premium


Premium


Premium

Premium


Premium


Premium

Premium

Premium


Premium

Premium


Premium


Premium


Premium


Premium

Premium

Premium


Premium

Premium


Premium


Premium


Premium


Premium


Premium


Premium

Premium