
- Home >
- Stock Photos >
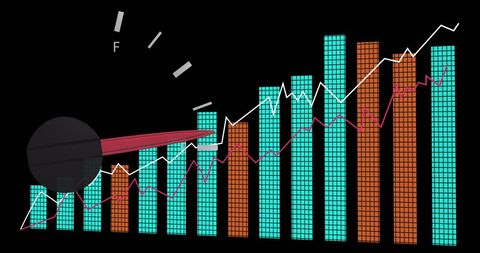
- Colorful 3D Bar Graph with Digital Interface Elements
Colorful 3D Bar Graph with Digital Interface Elements Image

Bright 3D bar graph features dynamic data visualization, combining geometric patterns, digital lines, and gradient transitions in a futuristic interface design. Combines digital elements and vibrant colors making it perfect for technology presentations, financial reports, economic trend analysis, and digital marketing materials to effectively communicate business and financial concepts visually.
Powered by  - Get 15% off with code: PIKWIZARD15


downloads
Tags:
More
Credit Photo
If you would like to credit the Photo, here are some ways you can do so
Text Link
photo Link
<span class="text-link">
<span>
<a target="_blank" href=https://pikwizard.com/photo/colorful-3d-bar-graph-with-digital-interface-elements/e028ed22e5577e2bde6ff0199fc3fdaa/>PikWizard</a>
</span>
</span>
<span class="image-link">
<span
style="margin: 0 0 20px 0; display: inline-block; vertical-align: middle; width: 100%;"
>
<a
target="_blank"
href="https://pikwizard.com/photo/colorful-3d-bar-graph-with-digital-interface-elements/e028ed22e5577e2bde6ff0199fc3fdaa/"
style="text-decoration: none; font-size: 10px; margin: 0;"
>
<img src="https://pikwizard.com/pw/medium/e028ed22e5577e2bde6ff0199fc3fdaa.jpg" style="margin: 0; width: 100%;" alt="" />
<p style="font-size: 12px; margin: 0;">PikWizard</p>
</a>
</span>
</span>
Free (free of charge)
Free for personal and commercial use.
Author: Creative Art
Similar Free Stock Images

Premium

Premium

Premium


Premium


Premium

Premium


Premium


Premium


Premium


Premium


Premium

Premium


Premium

Premium

Premium


Premium


Premium


Premium


Premium


Premium


Premium


Premium


Premium


Premium


Premium


Explore More Free Stock Images